South Africa’s 2026 Local Government Elections
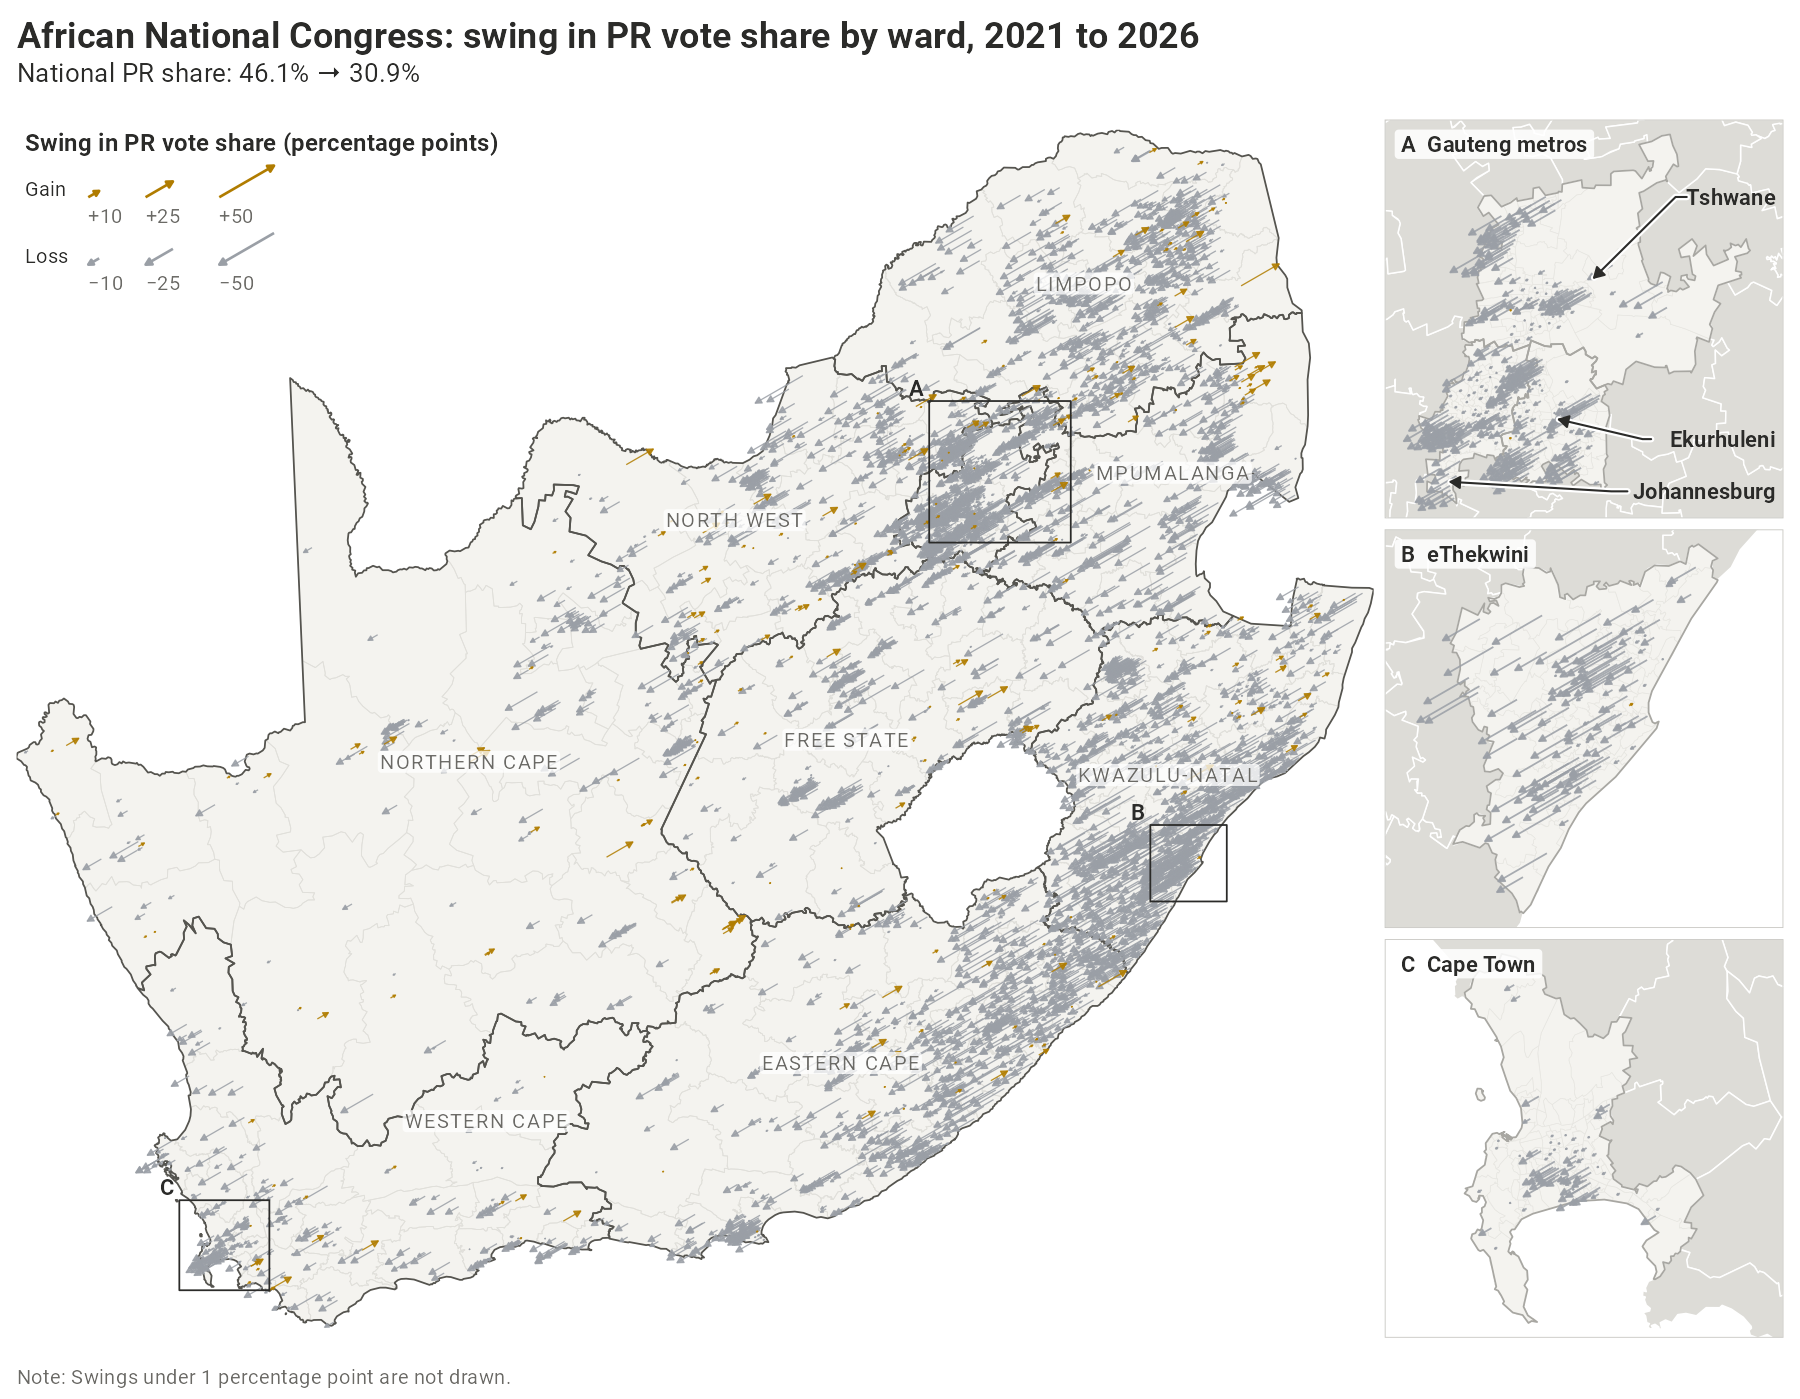
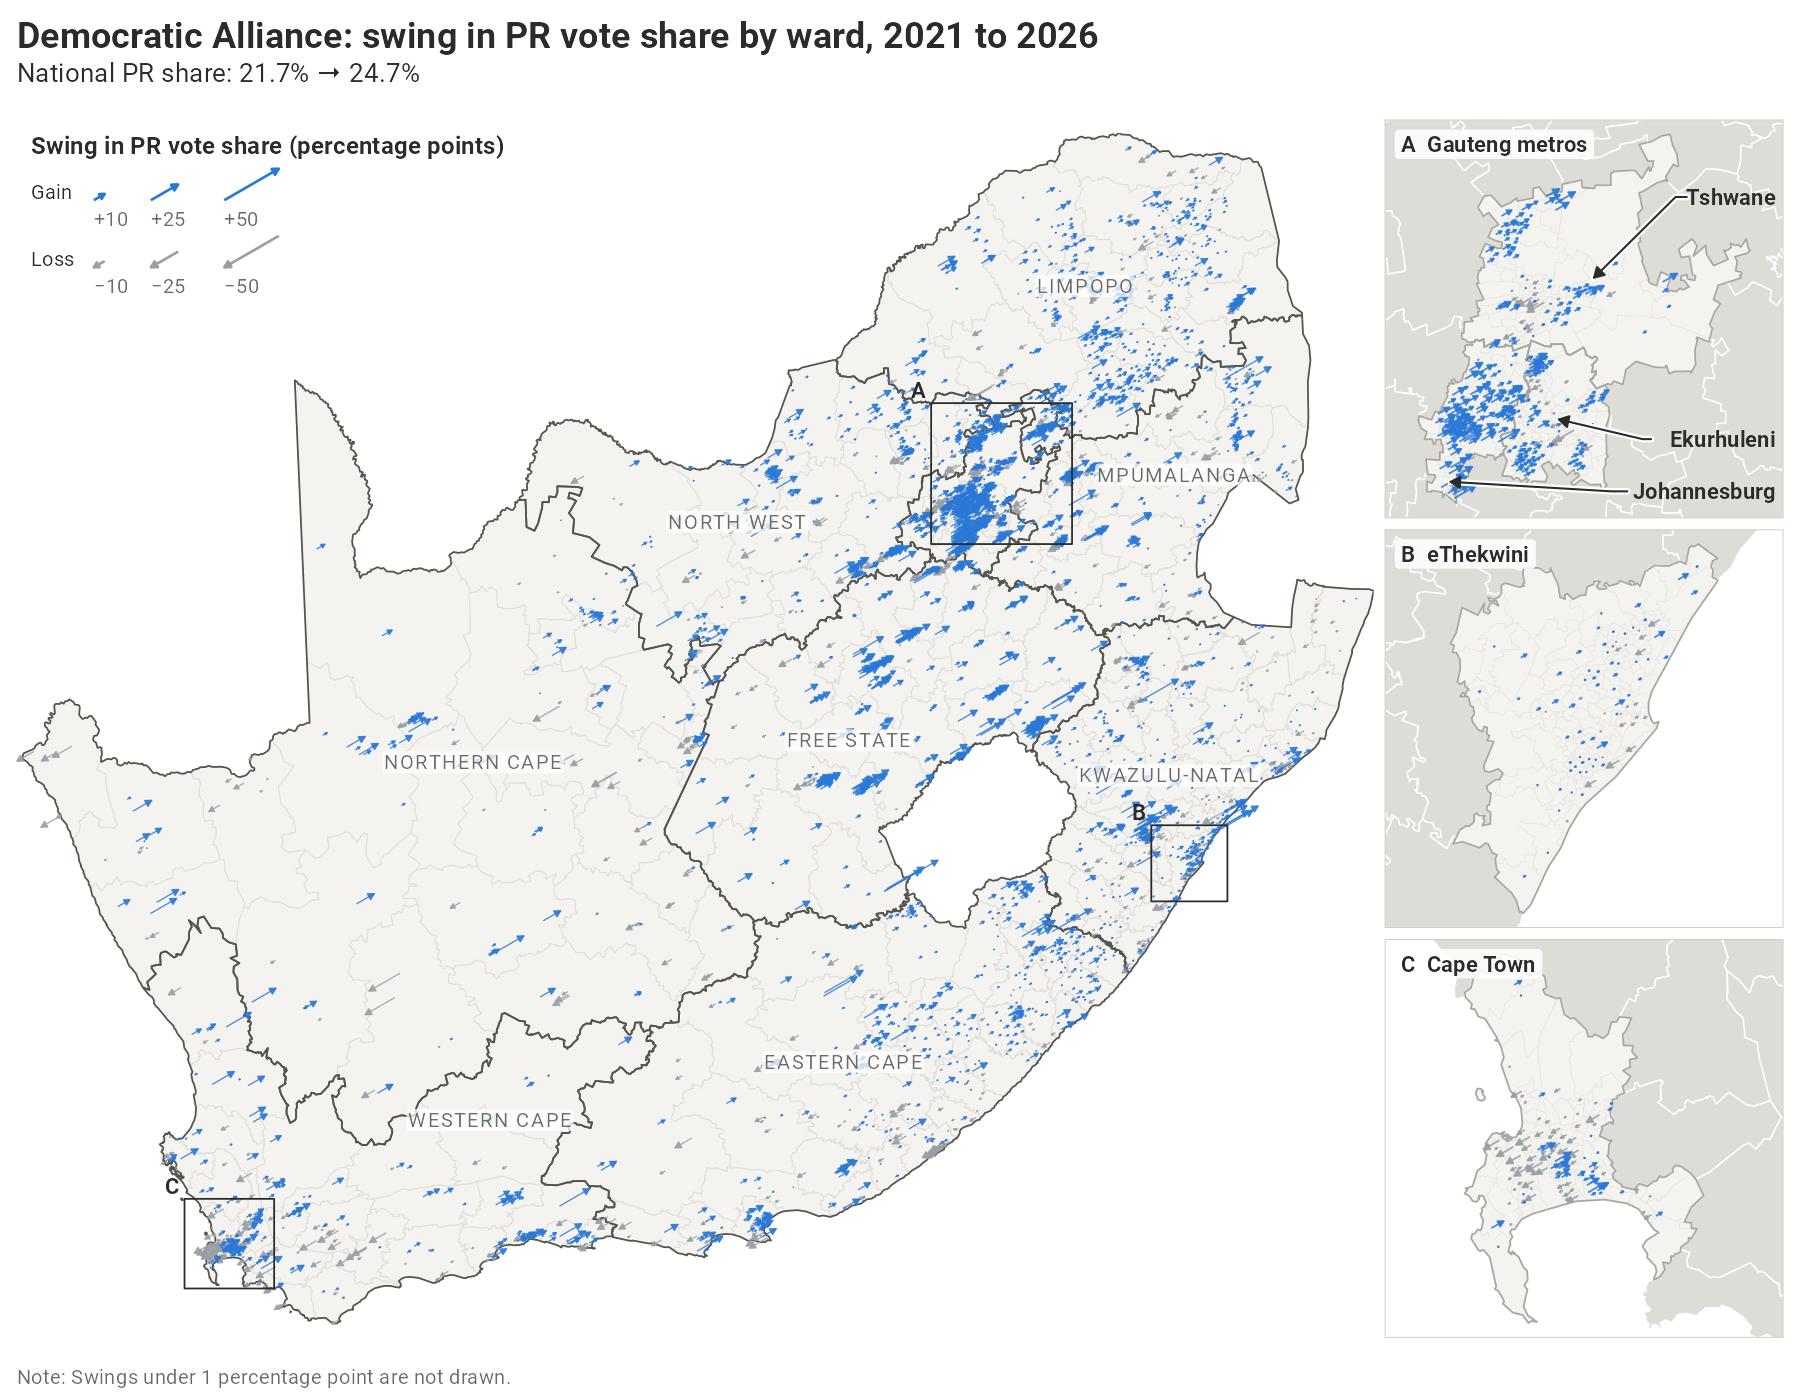
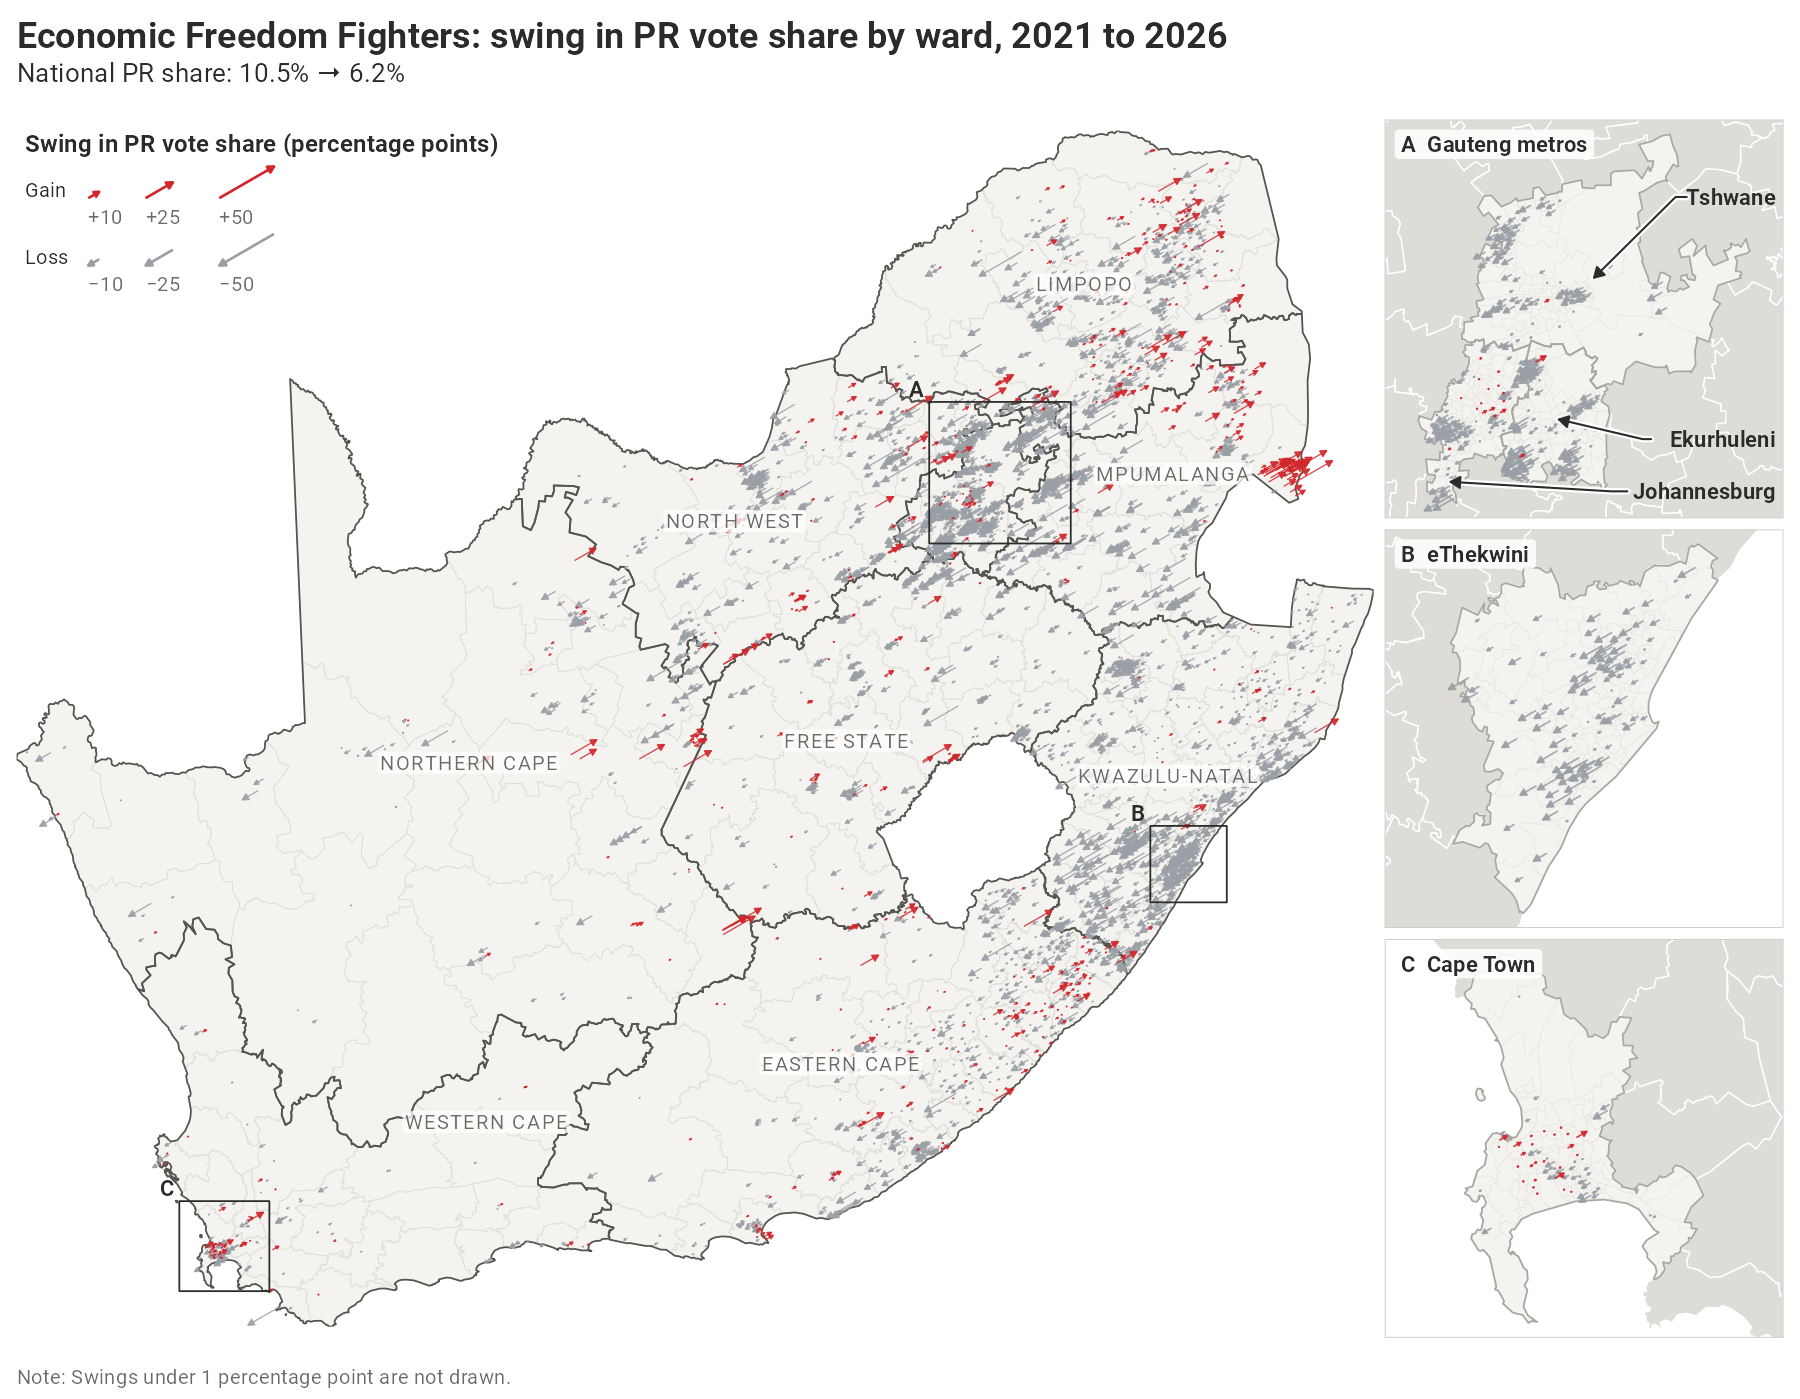
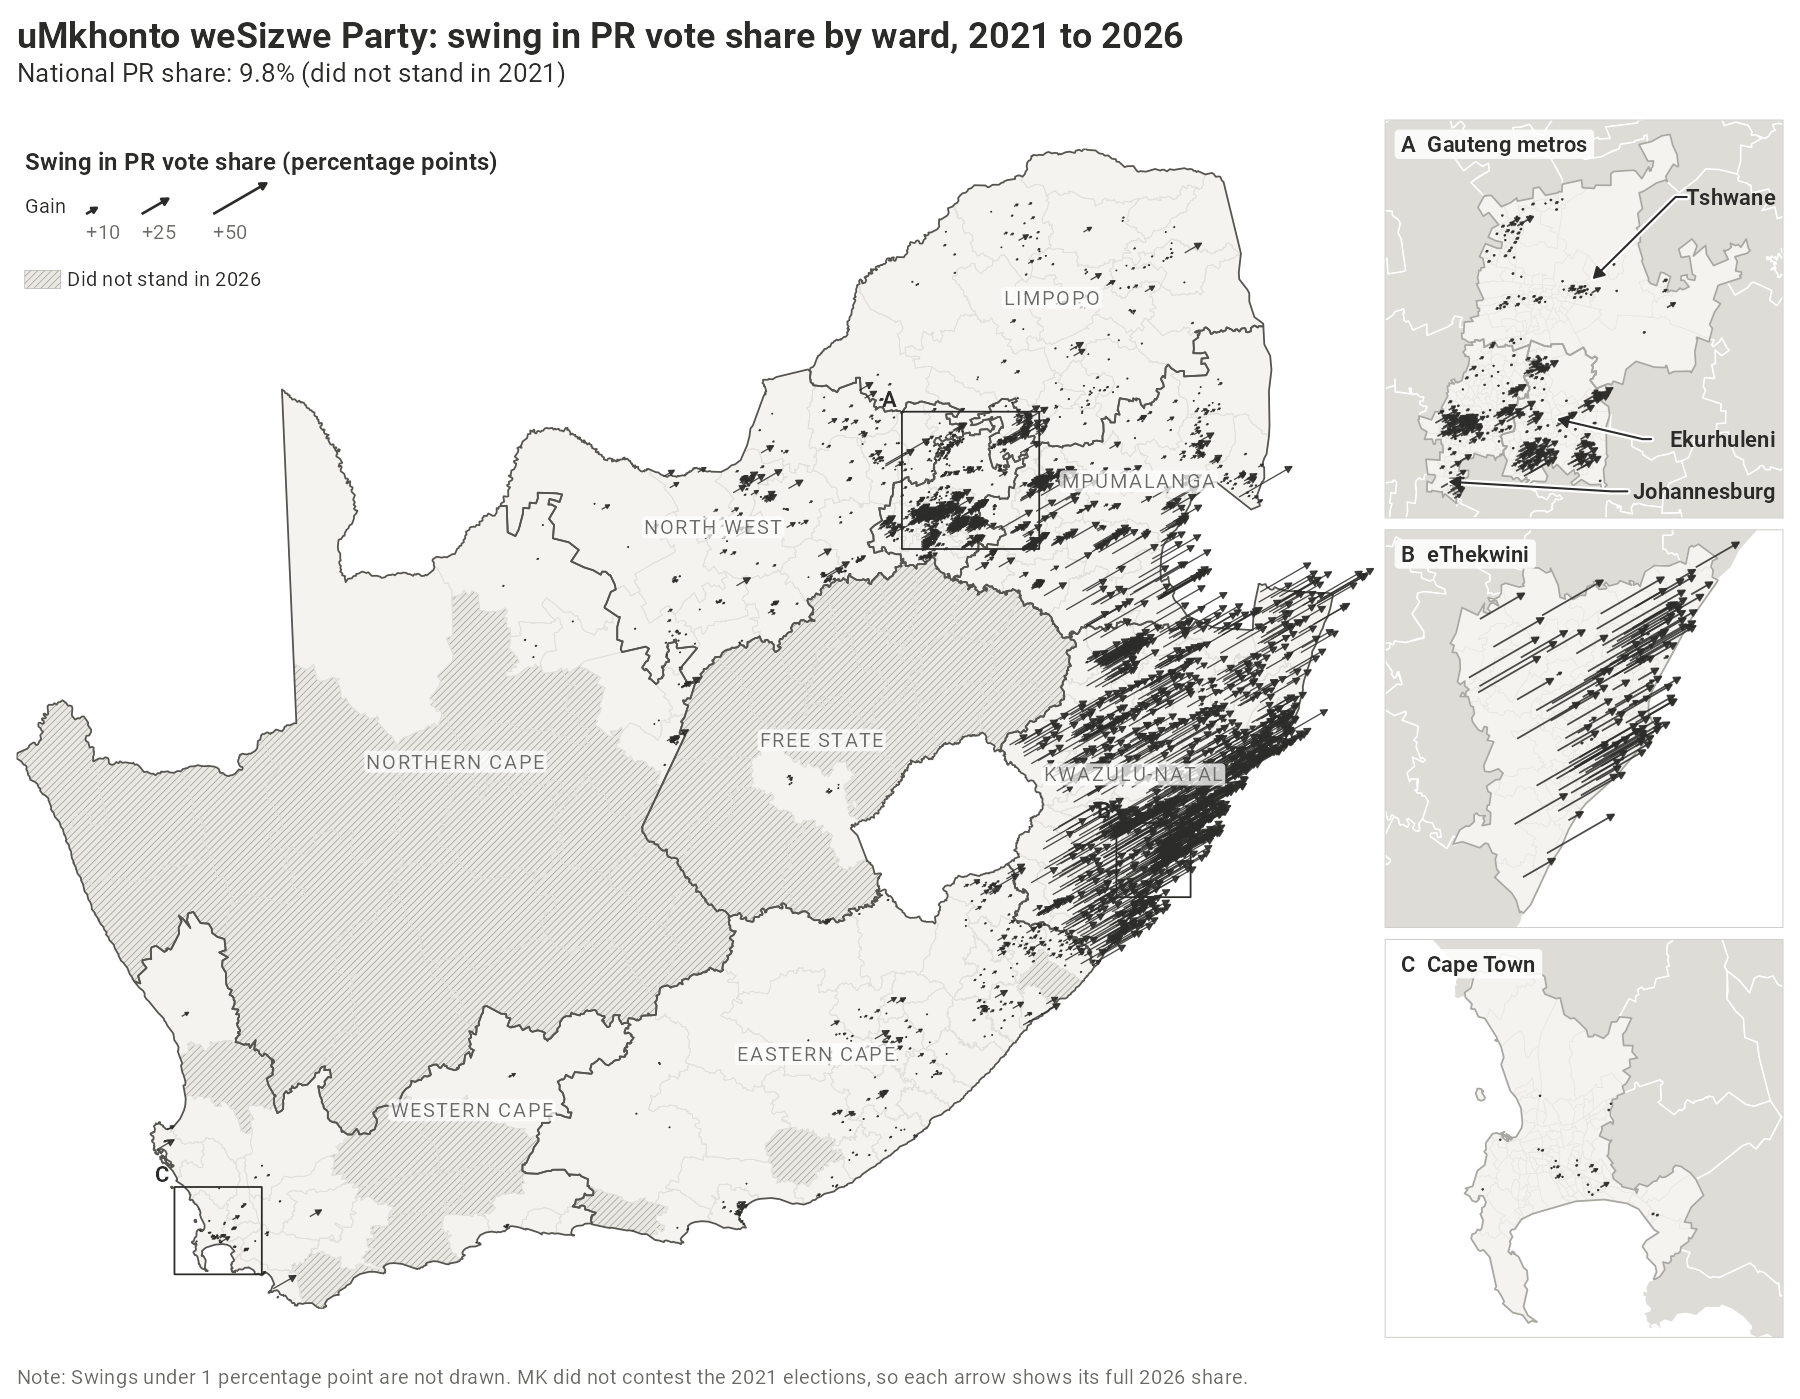
15.2 million South Africans voted on November 4th 2026 in the country’s seventh local government elections (LGE). On this site you will find a variety of presentations of the election results. Most of the maps focus on five parties: the African National Congress (ANC), the Democratic Alliance (DA), the Economic Freedom Fighters (EFF), the uMkhonto weSizwe Party (MK), and ActionSA. There is also an interactive ward-level map that allows you to explore the results and a tool for conducting cross-sectional analyses of census data and election outcomes.
The LGE are elections in which South Africans choose who will run their municipal governments – the lowest level of administration in the South African state. Voters in the eight metropolitan municipalities cast two ballots, and voters elsewhere three: one for their ward councillor, one for a party list for their local or metropolitan municipal council (the proportional representation, or PR, ballot), and one for their district municipal council. About half of each municipal council’s seats go to the winners of its wards; the rest are filled from the party lists, so that each party’s share of the council’s seats matches its share of the ward and PR votes combined.
Please note that the maps on this site show the PR ballot alone, on which every voter in a municipality chooses among the same parties. This measures support for parties rather than for individual candidates within those parties. The Electoral Commission’s results dashboard reports ward and PR votes added together, so there are some minor differences between what is shown here and what is shown there. See the data and methods tab for a discussion of the correlation between ward and PR votes, which is very high. All results are provisional: they were taken from the Electoral Commission before it certified them.
For those interested in learning more, this short video from the Civics Academy explains how the local government elections work.
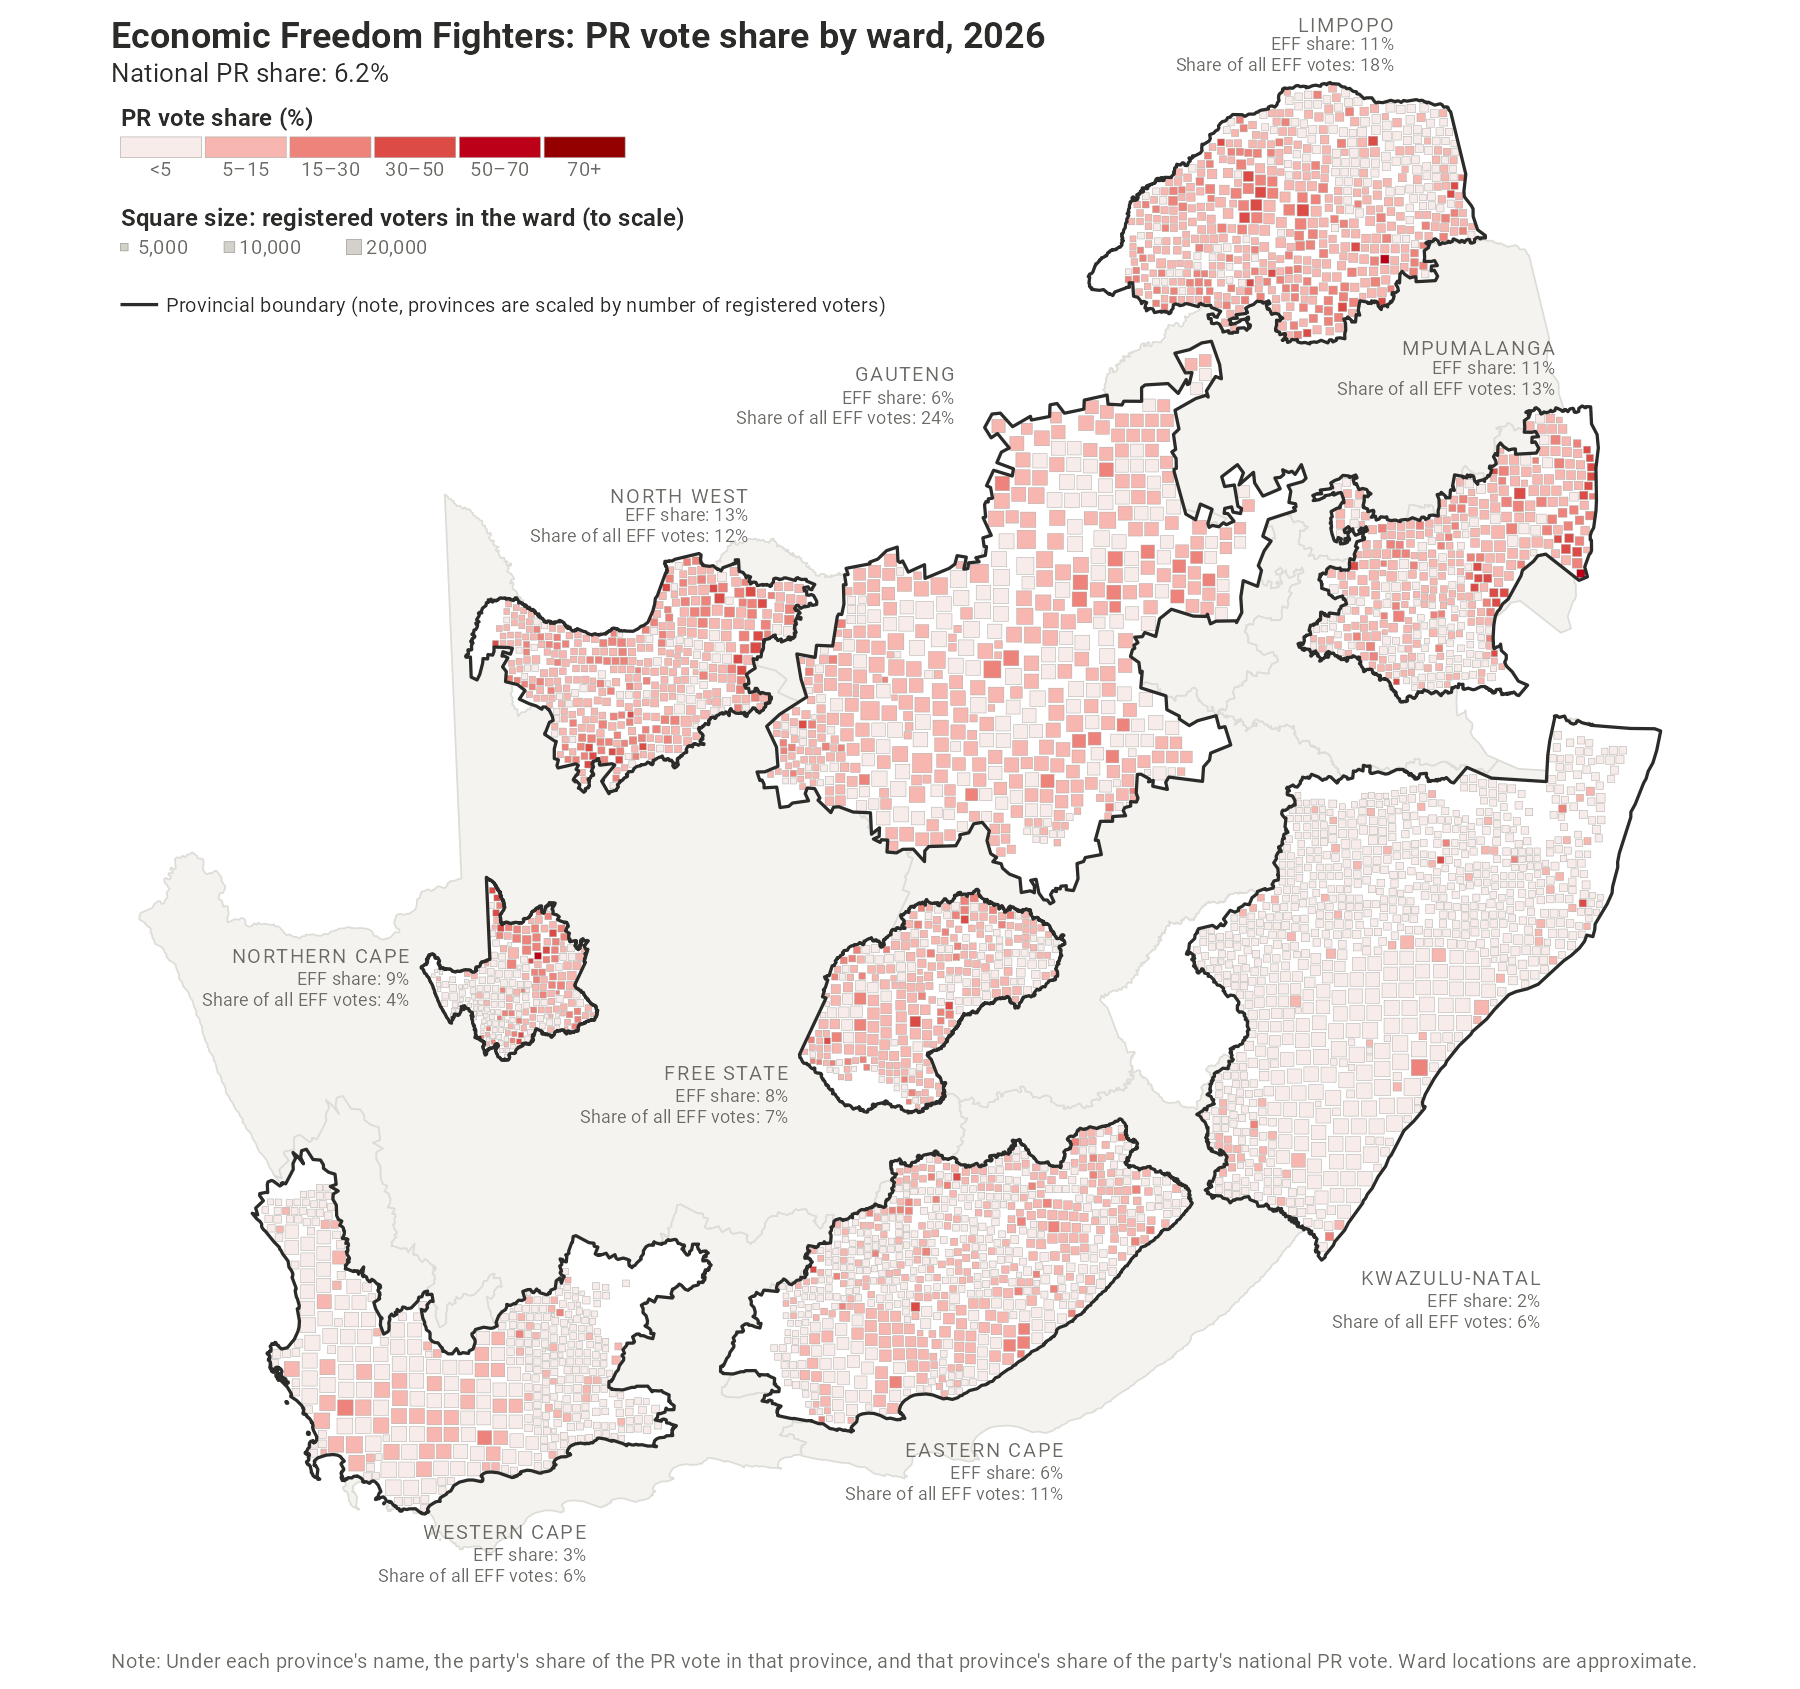
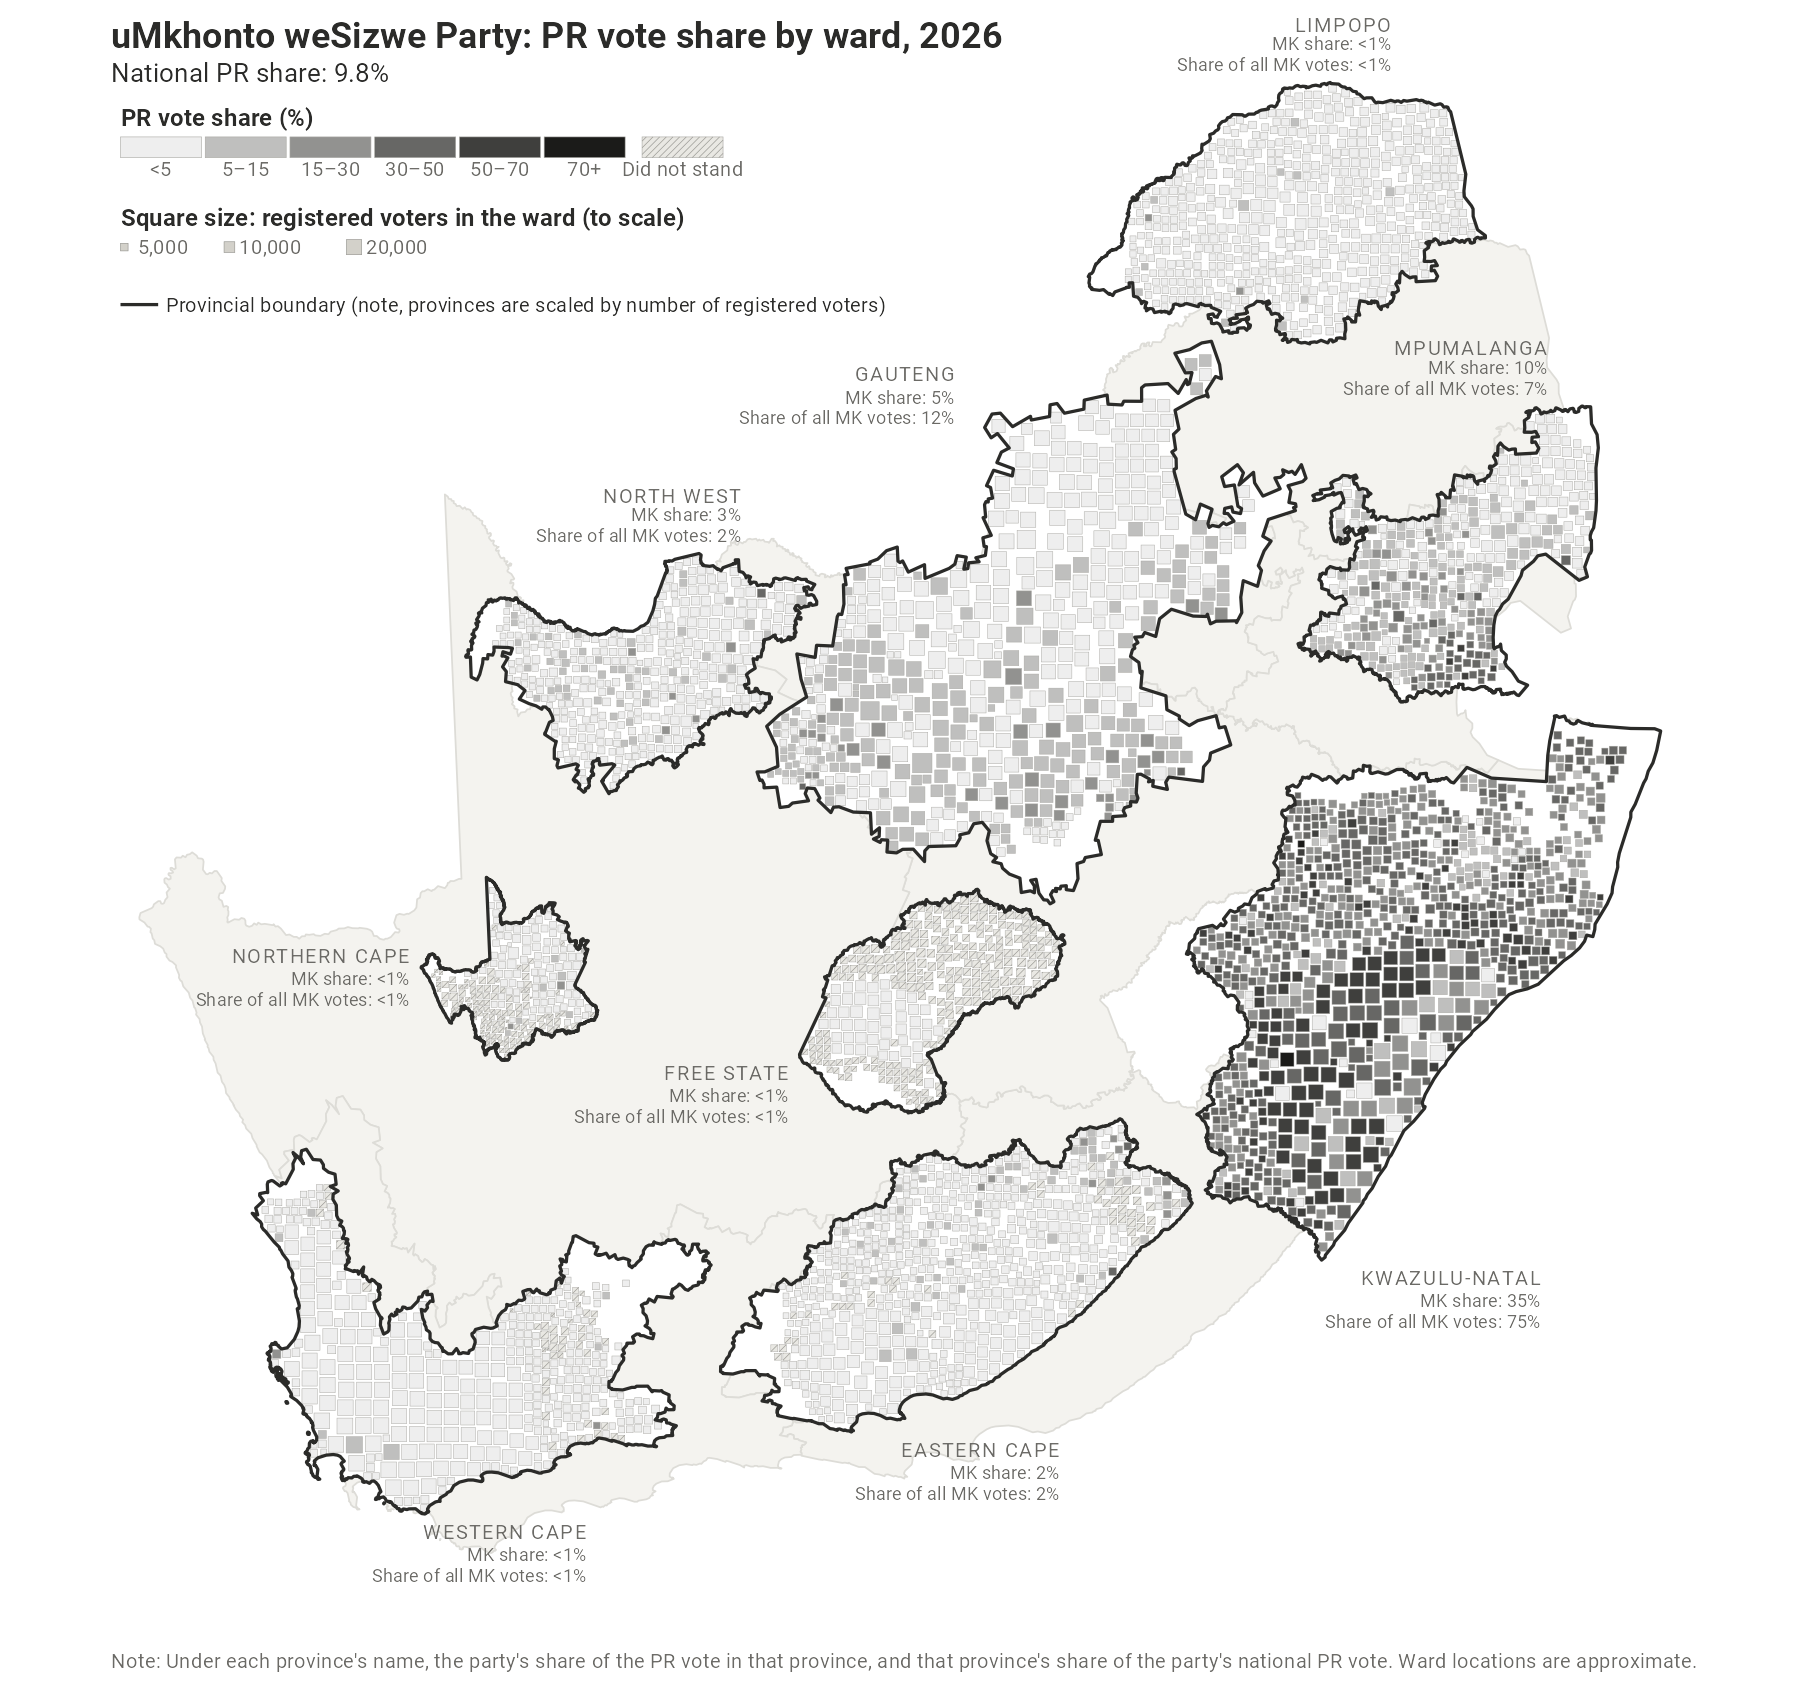
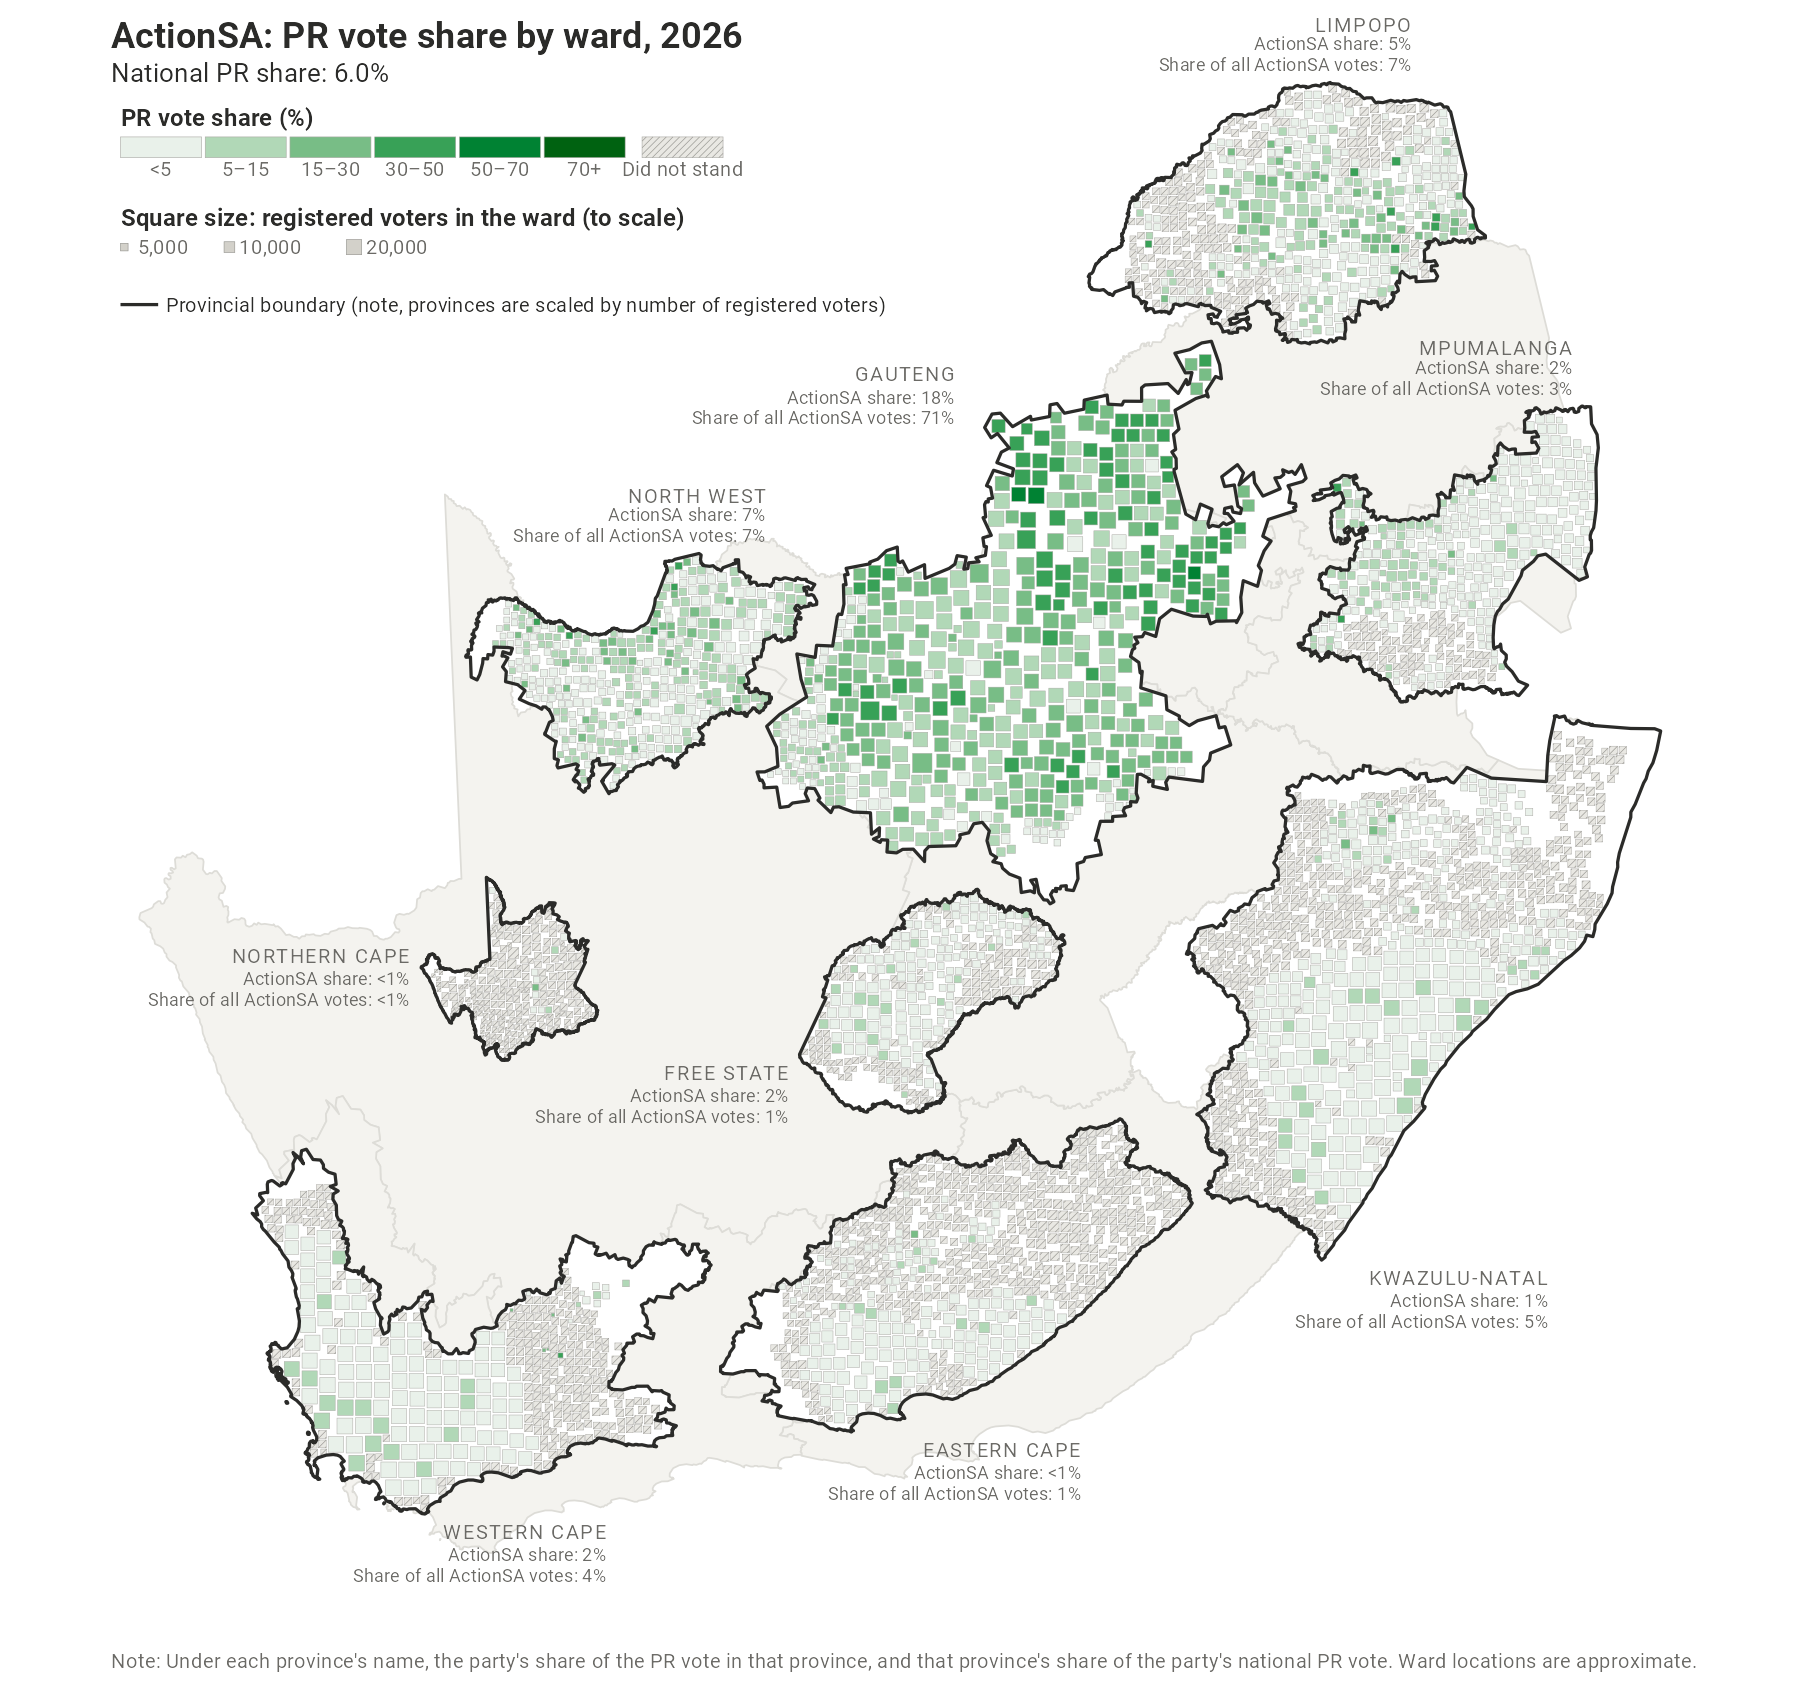
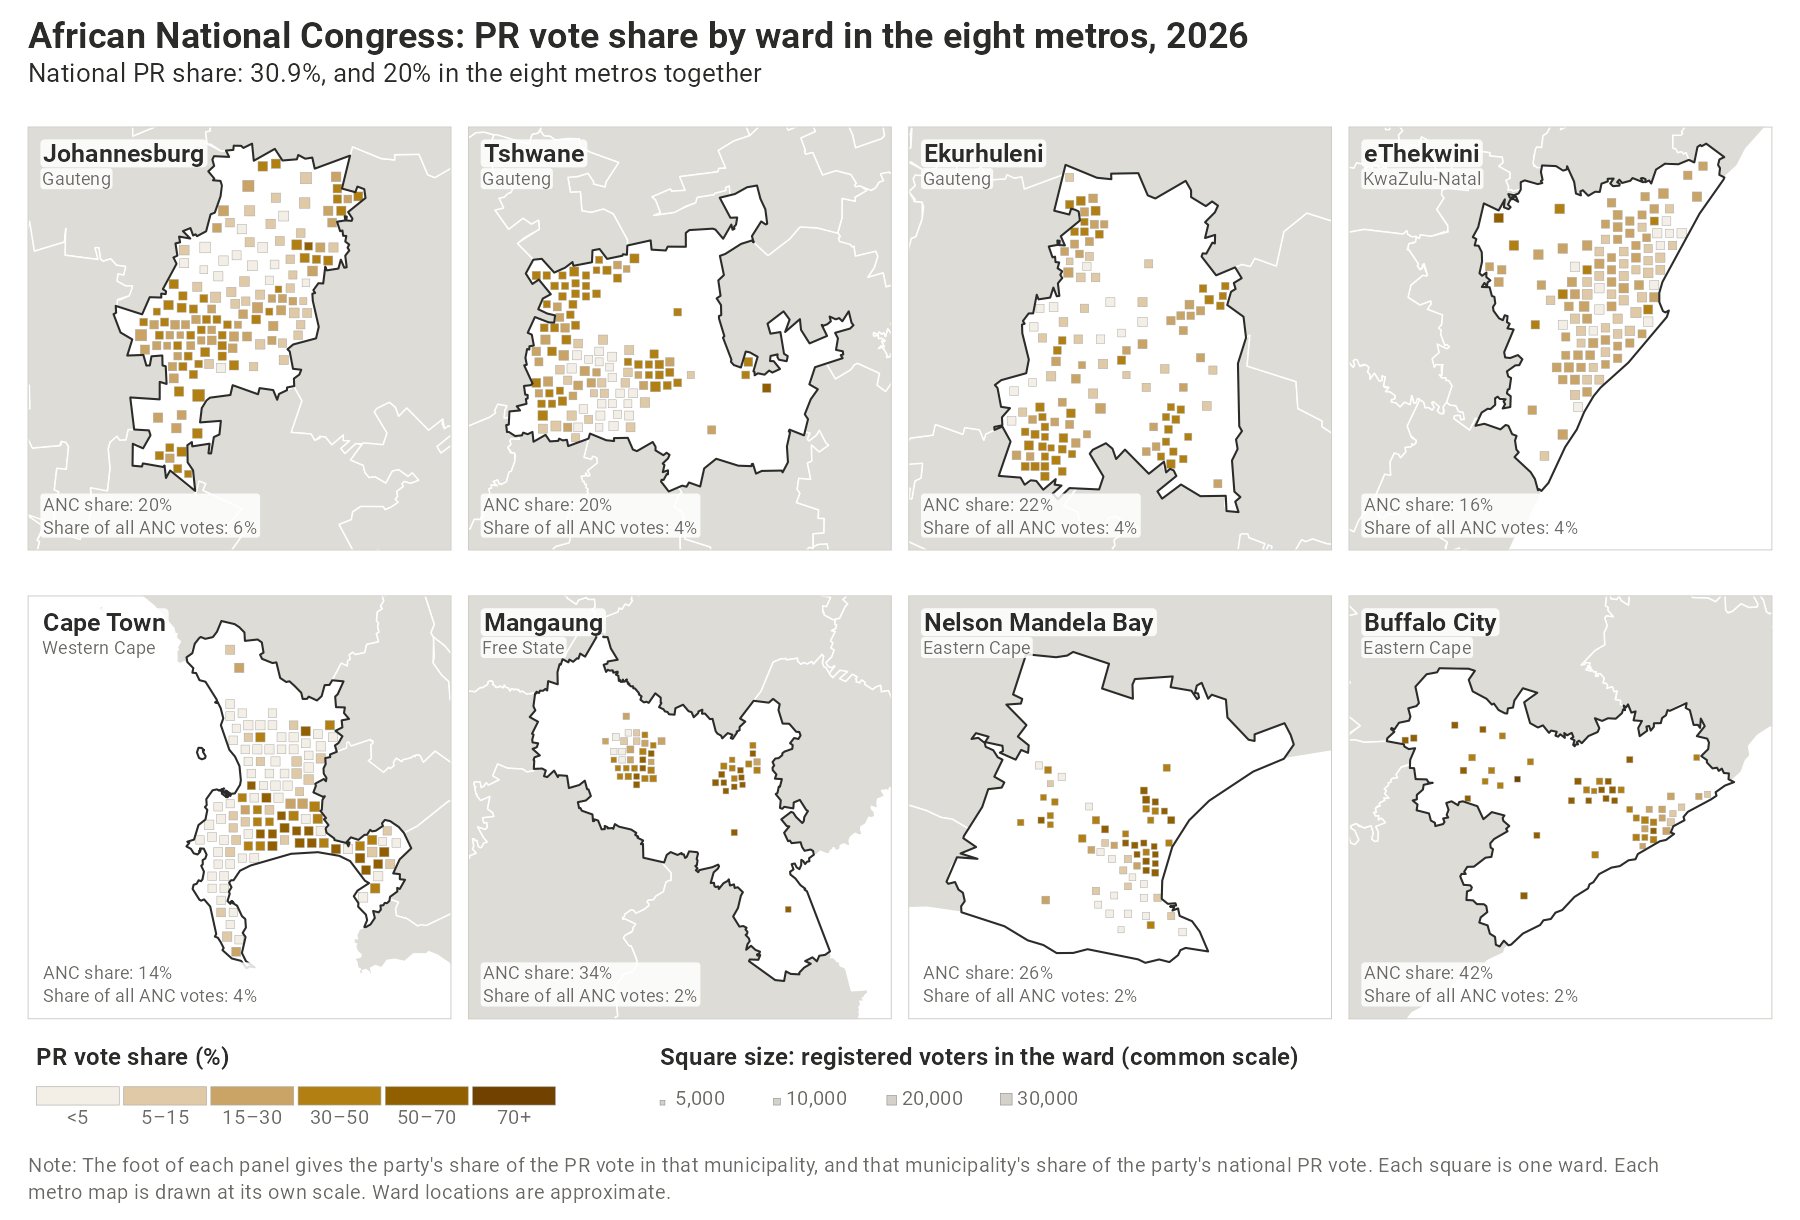
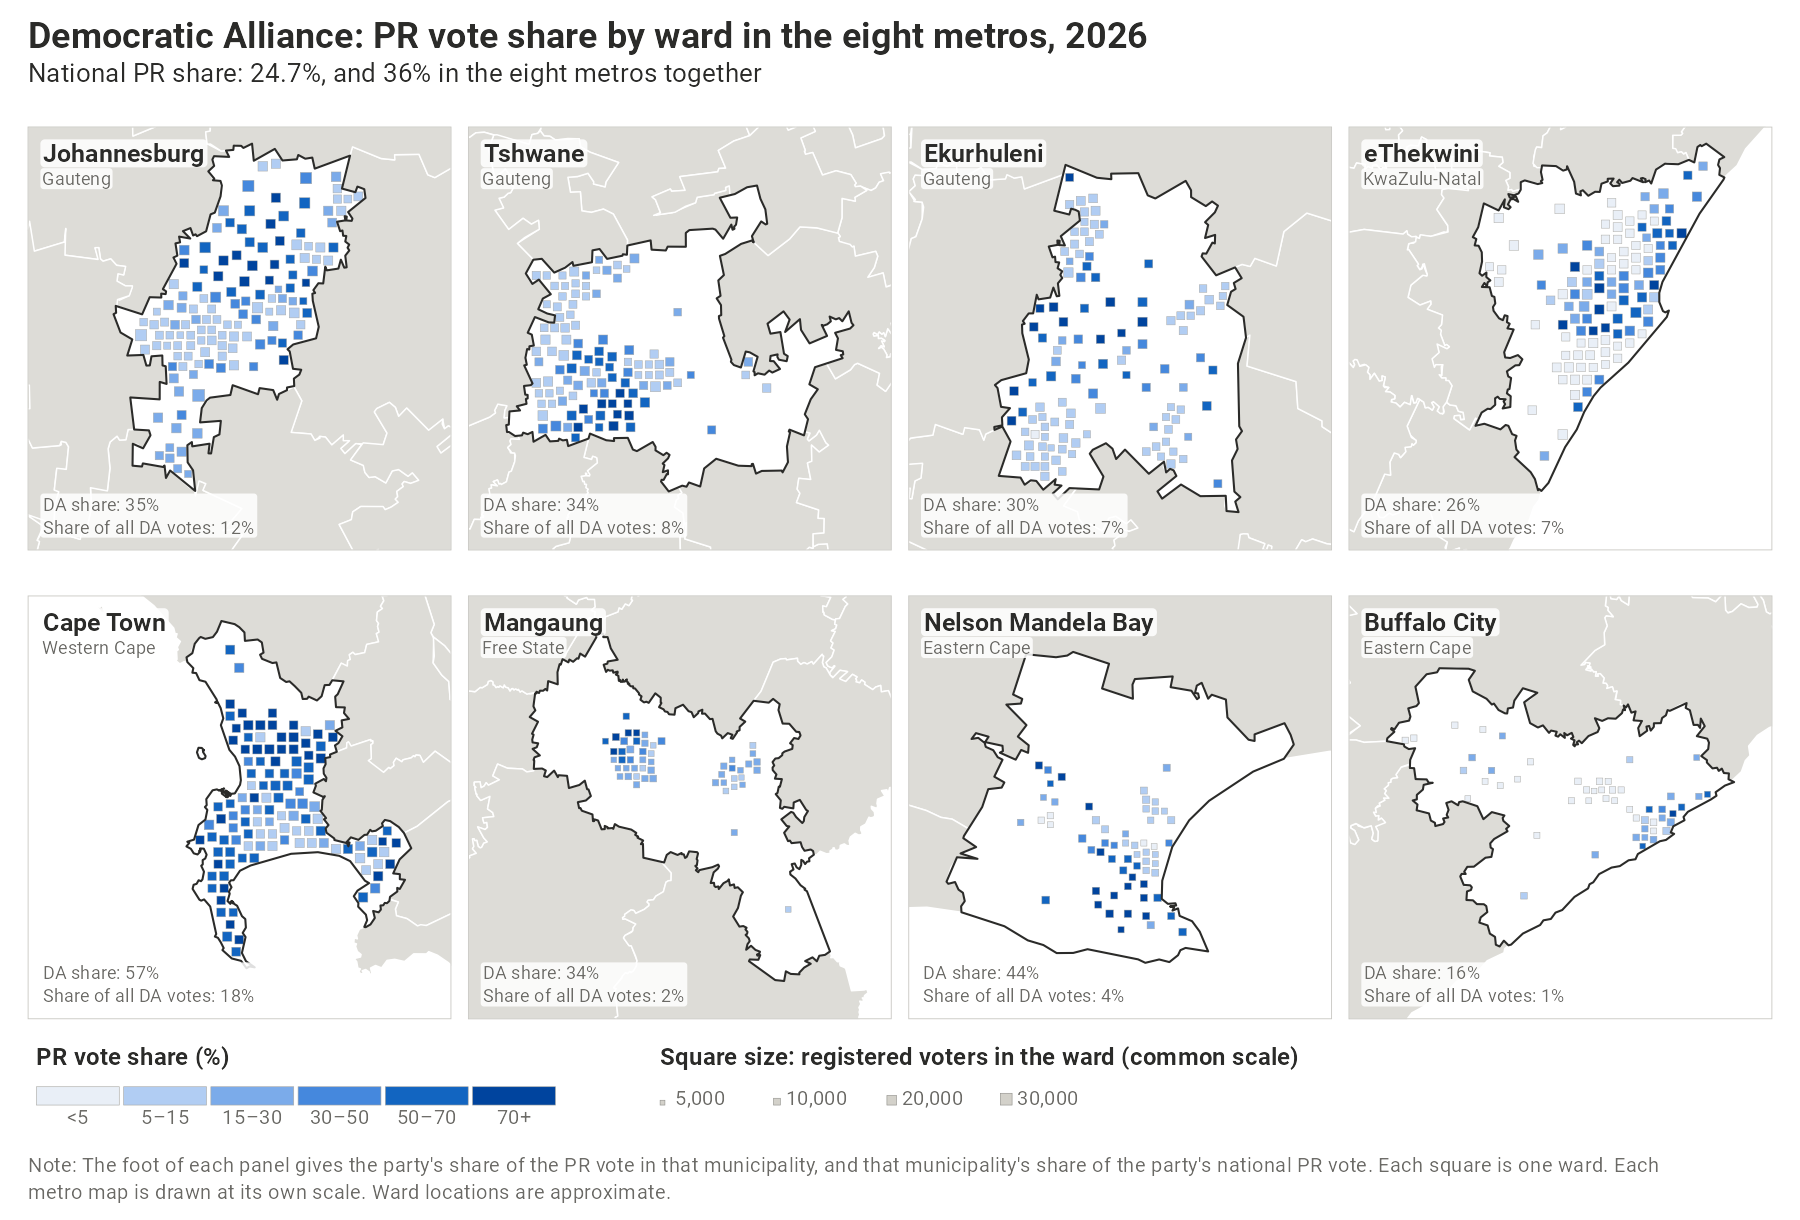
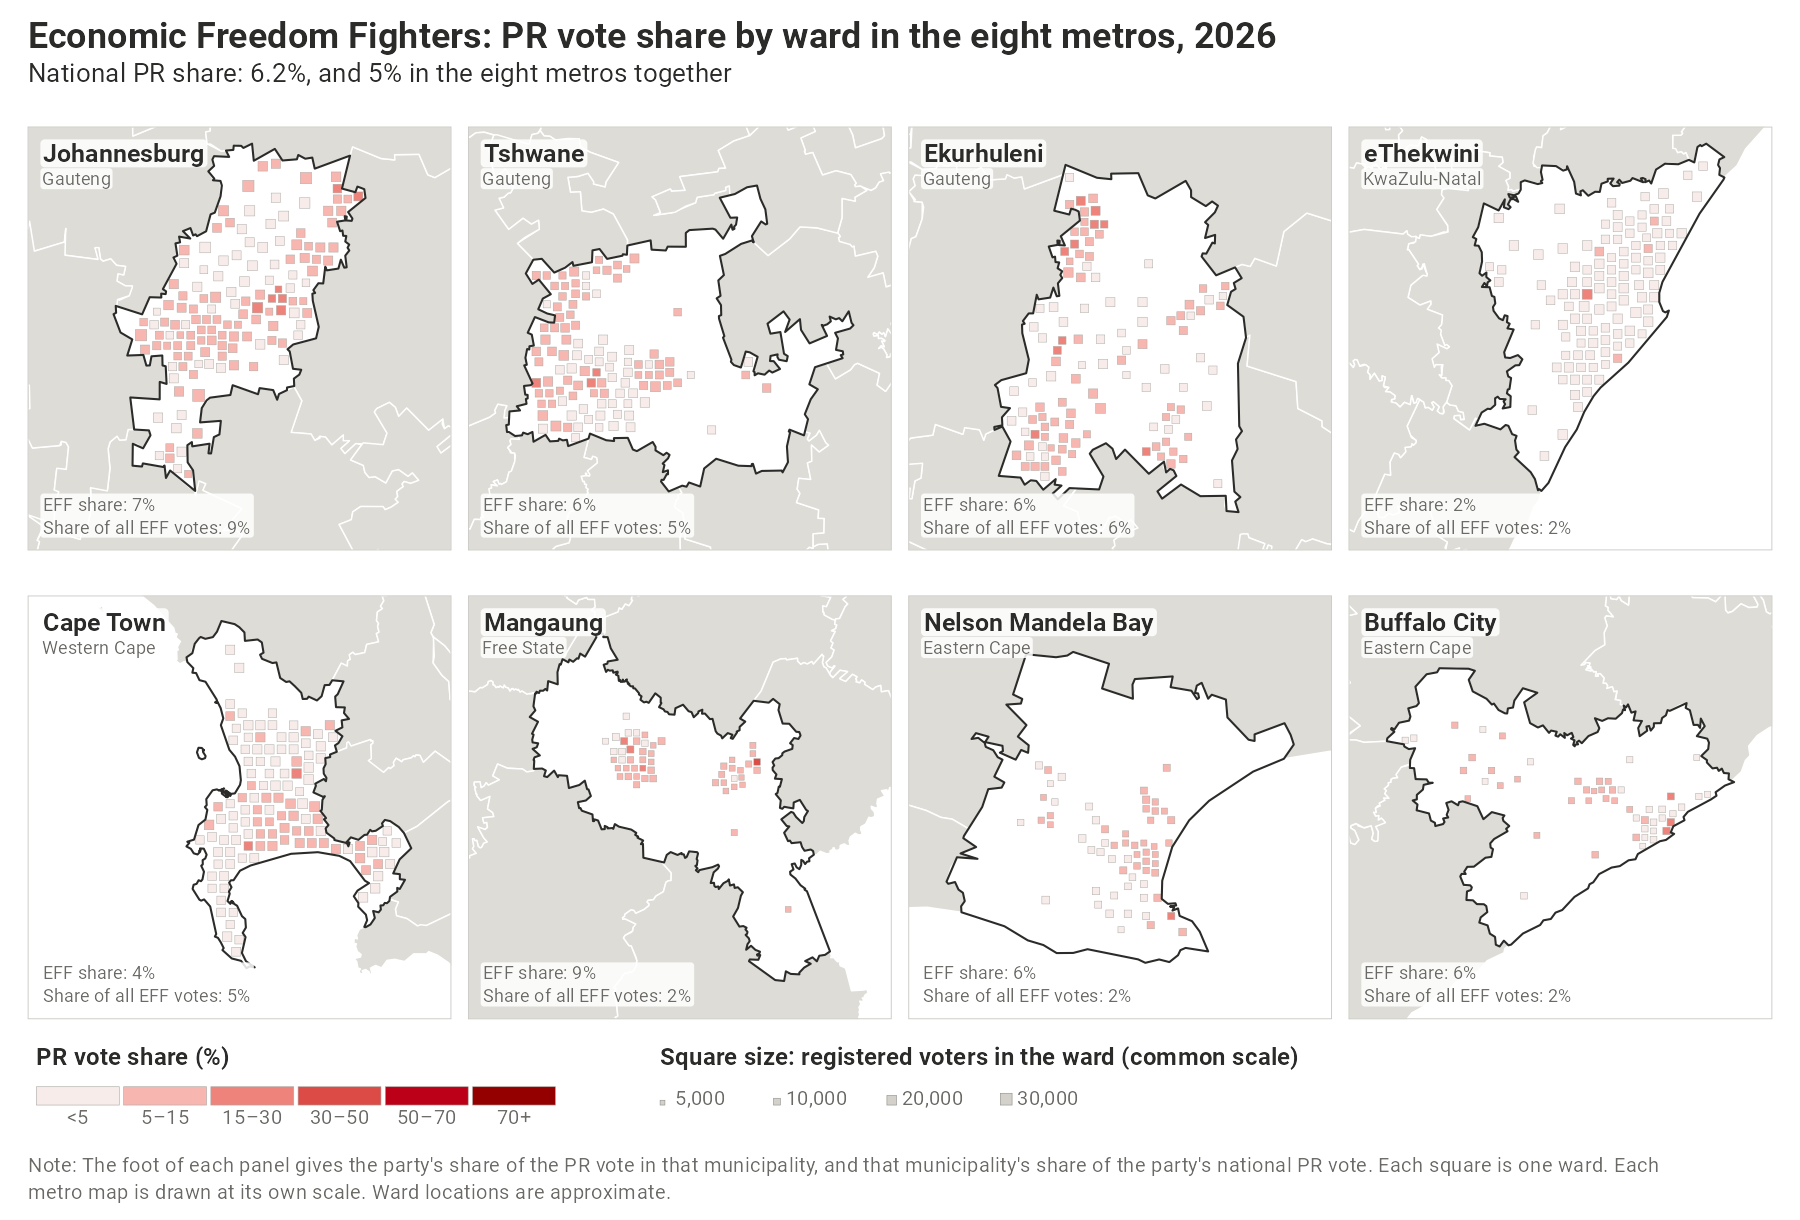
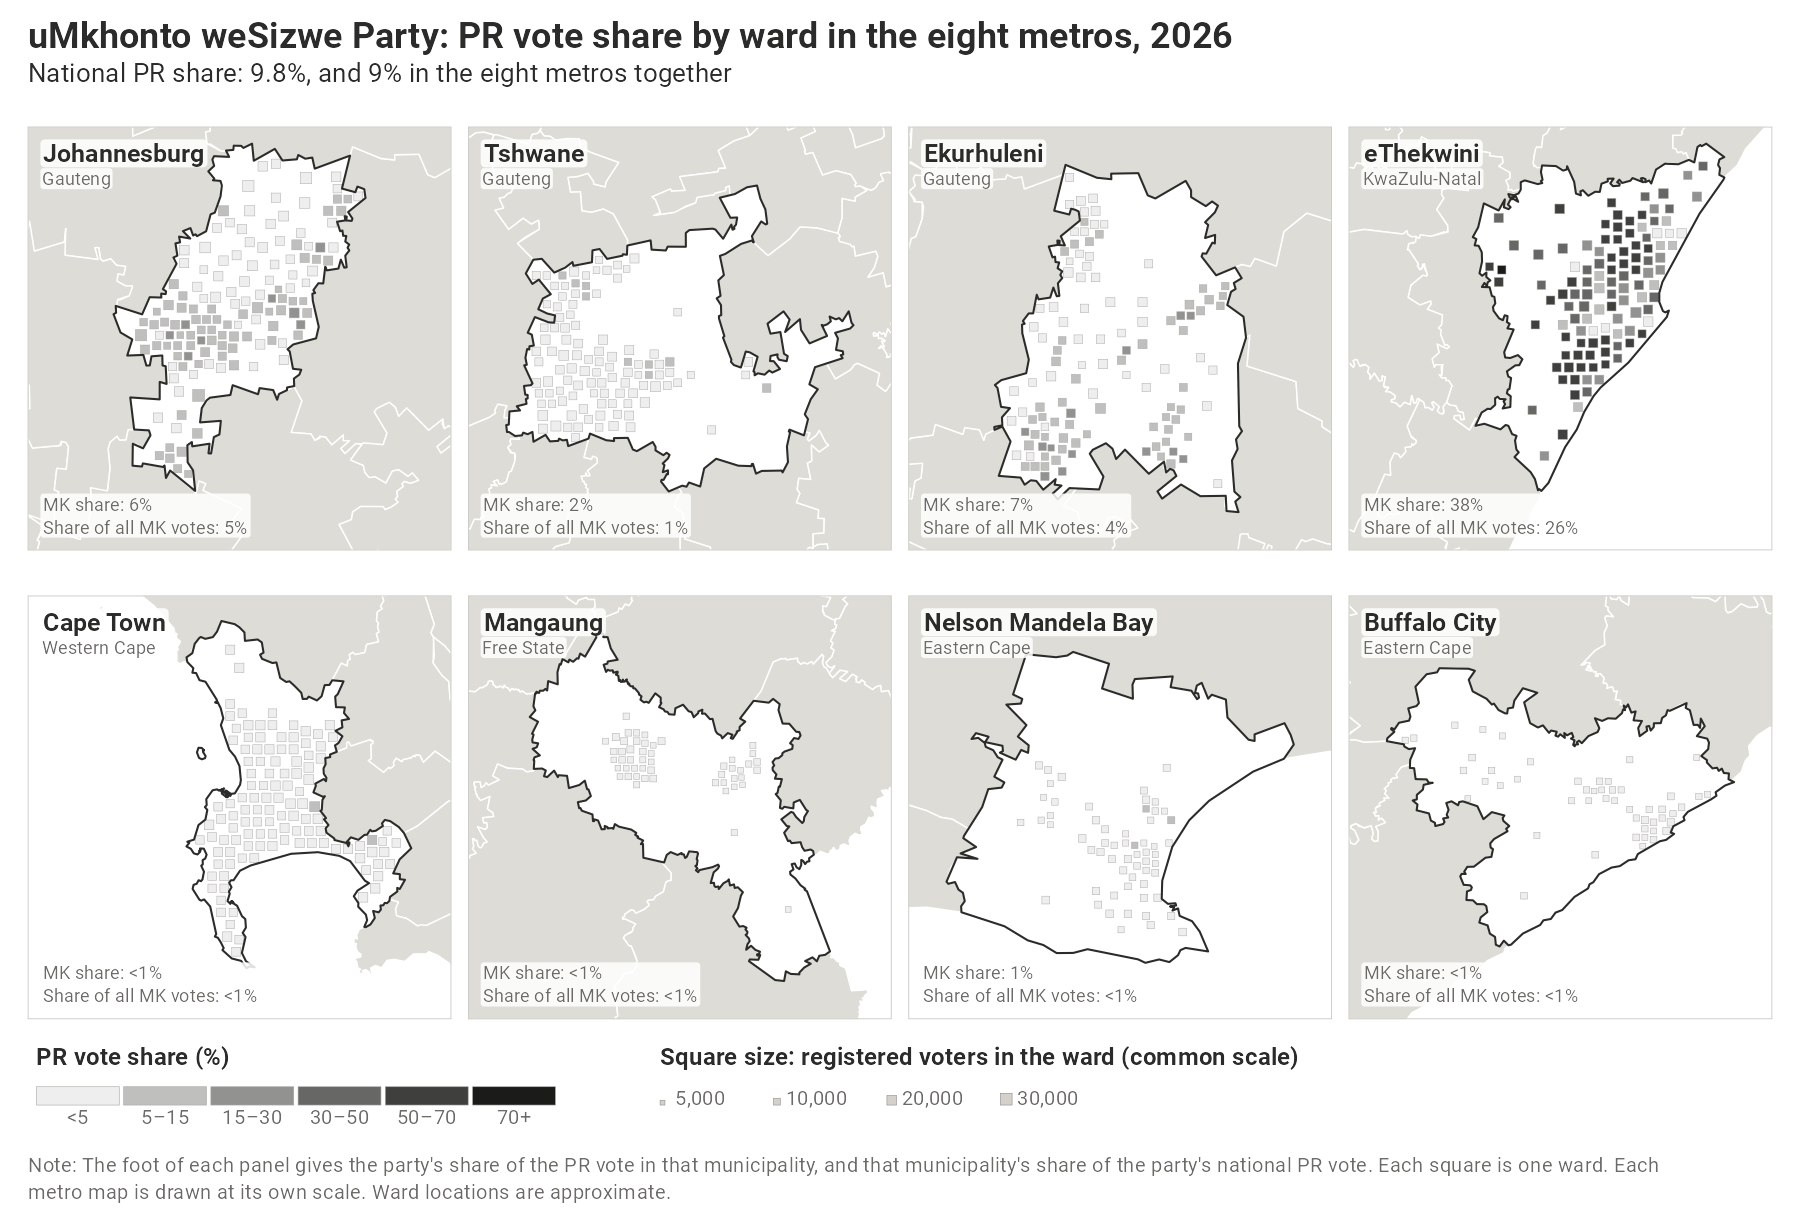
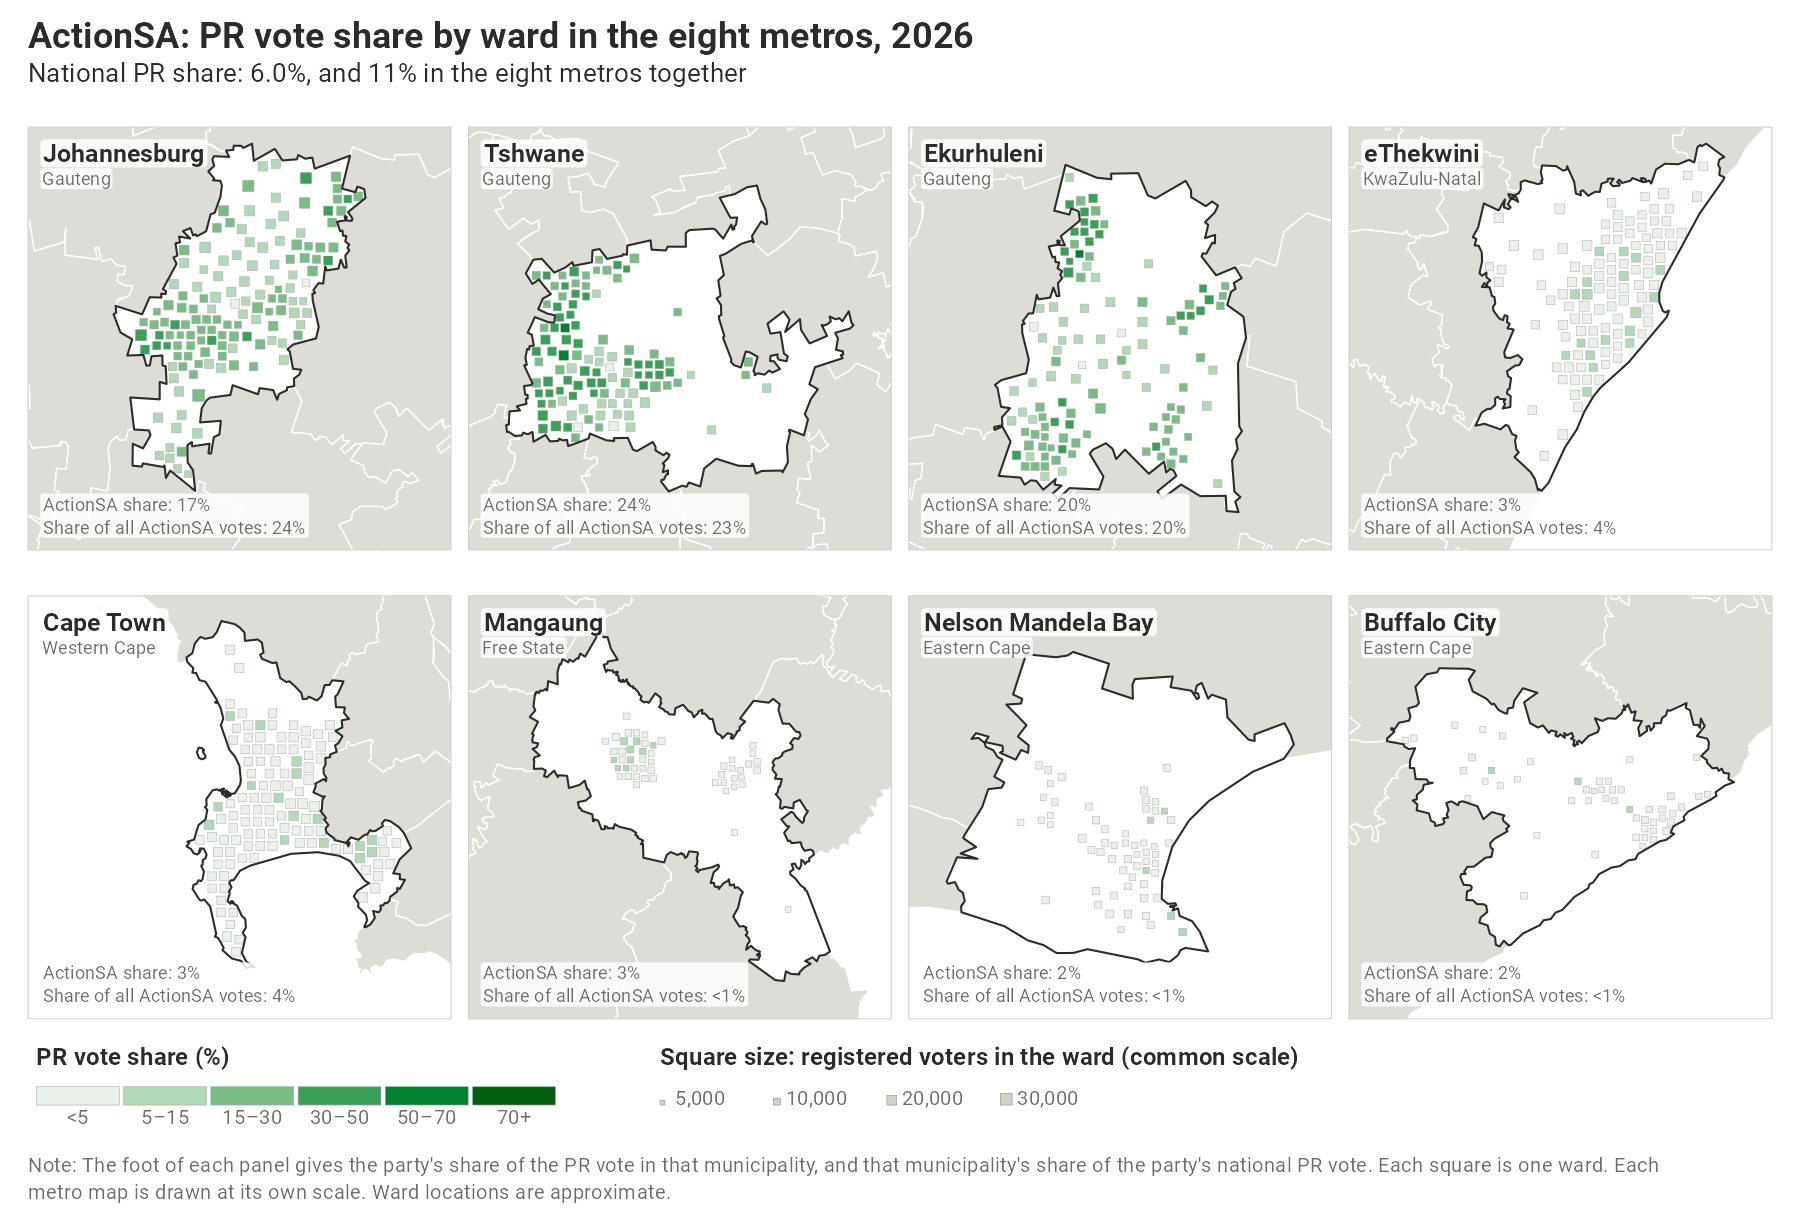
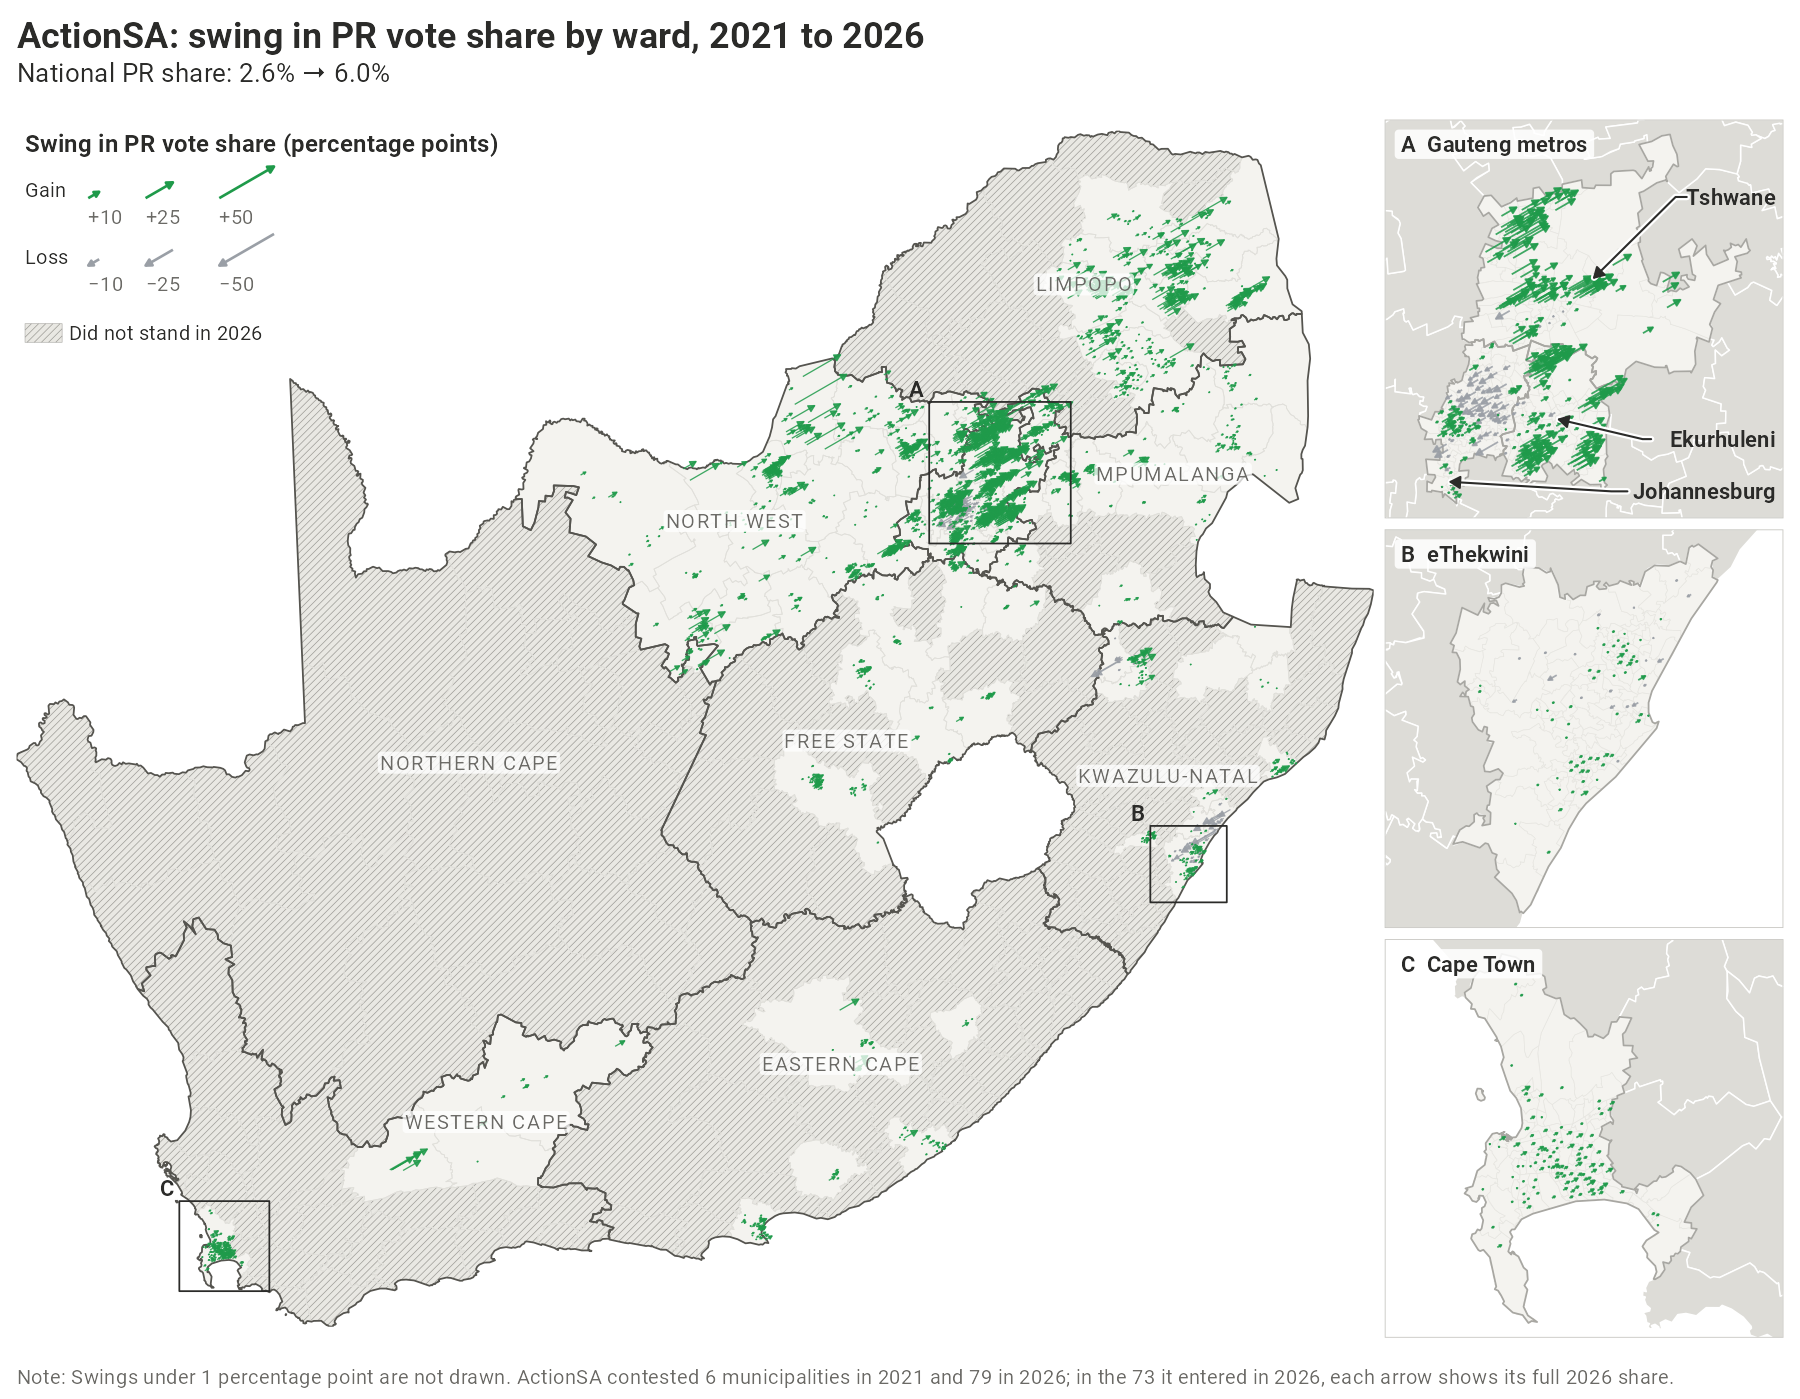
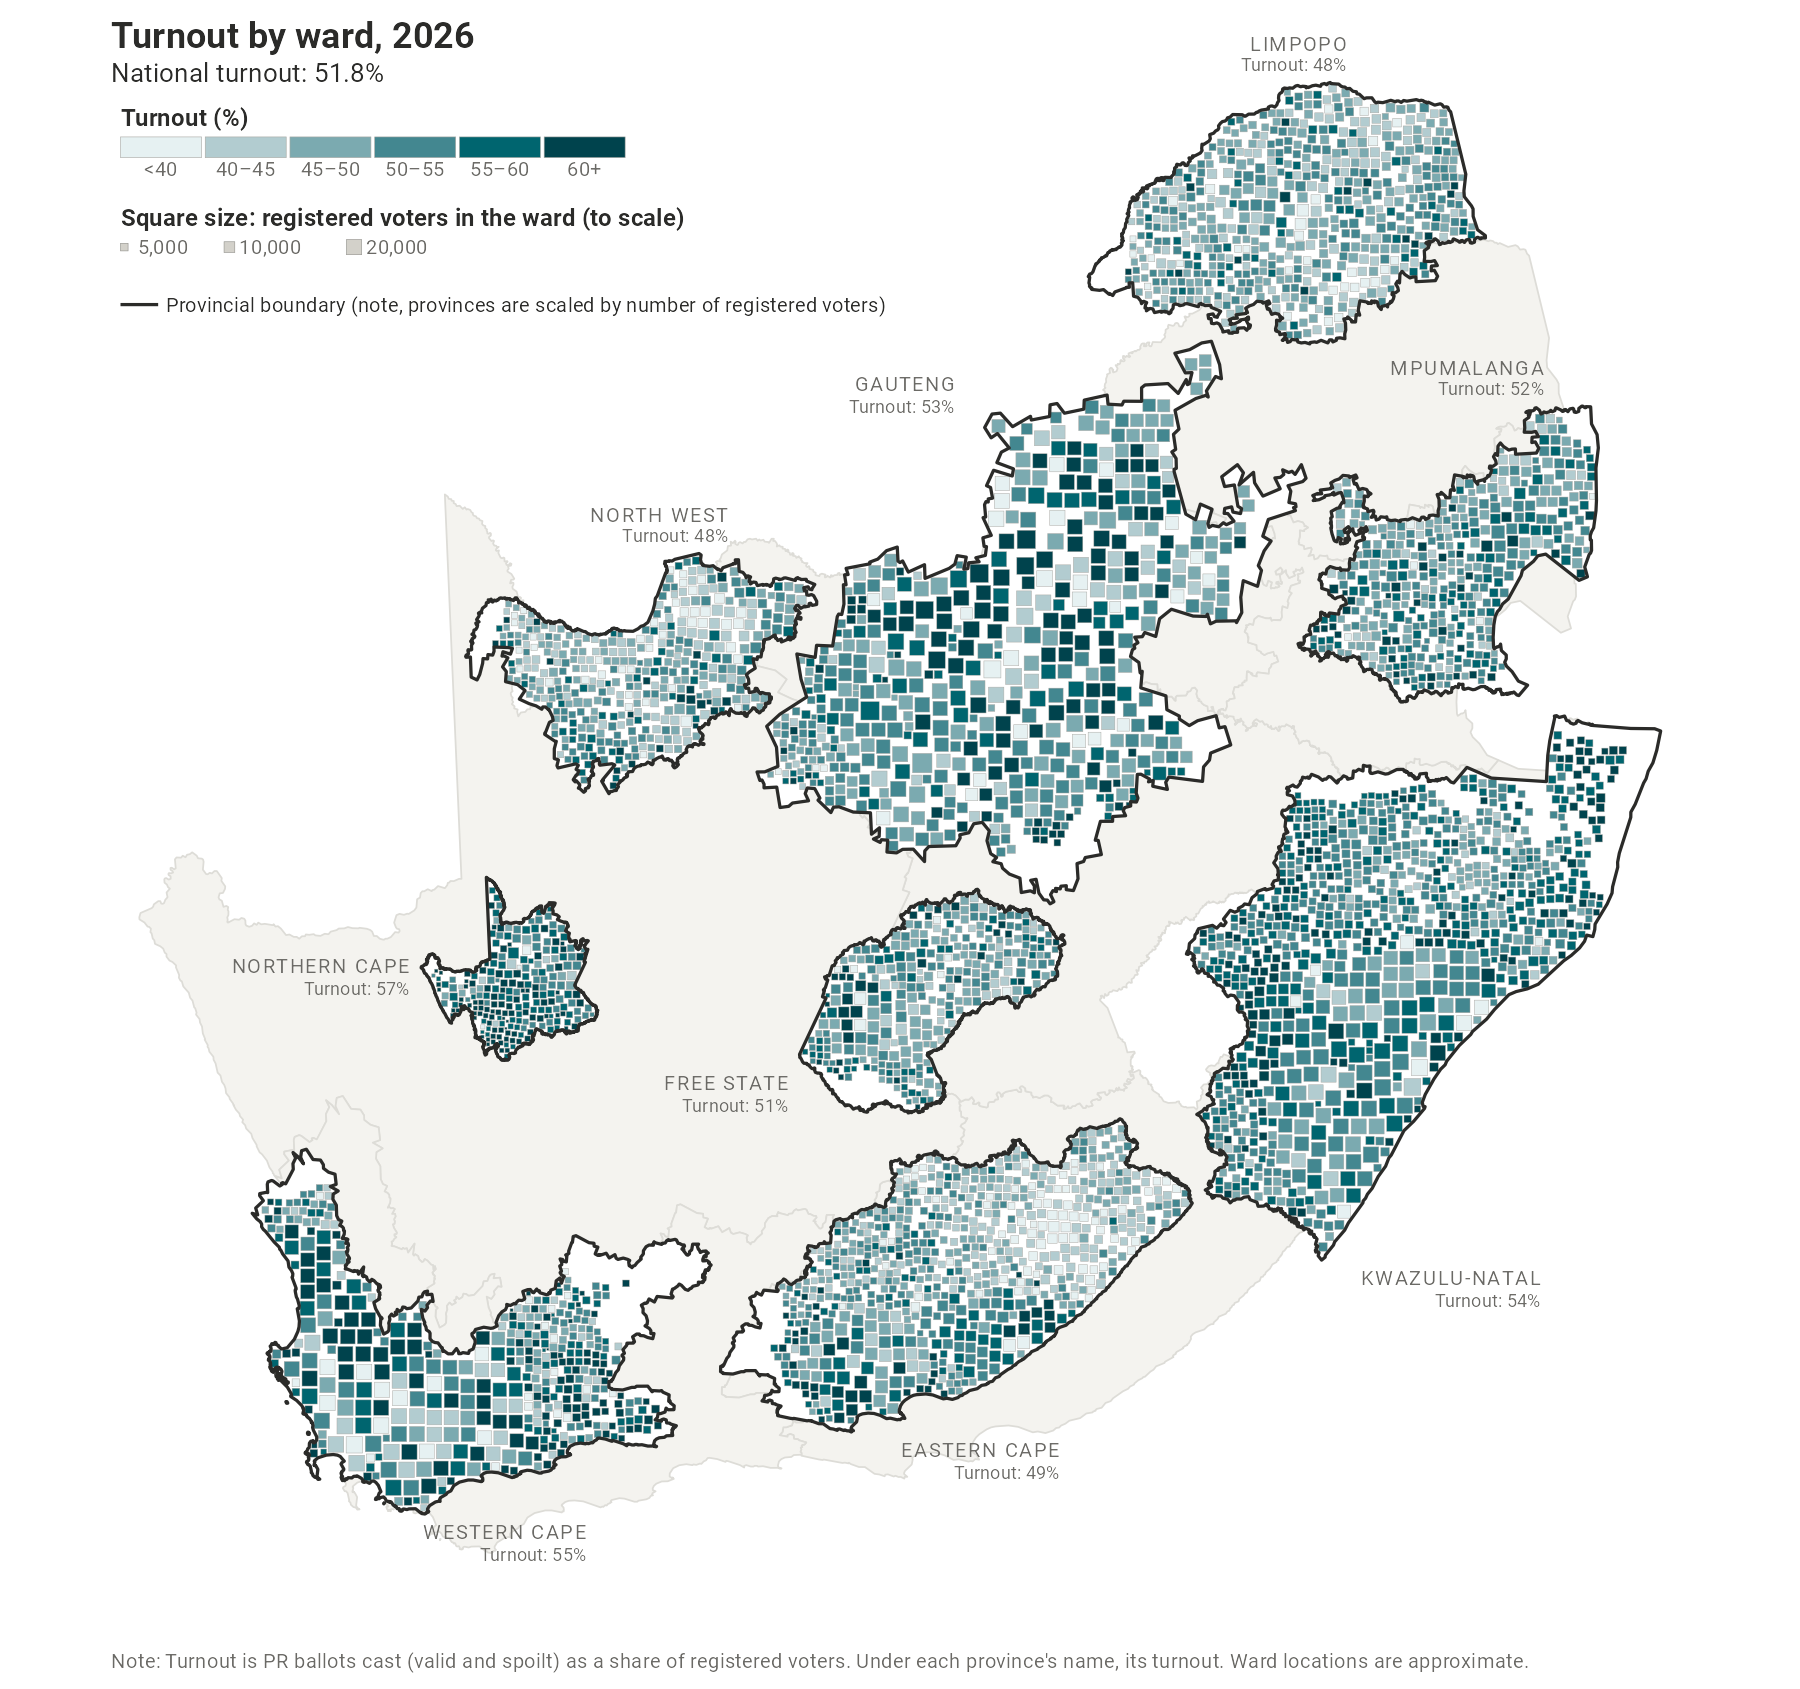
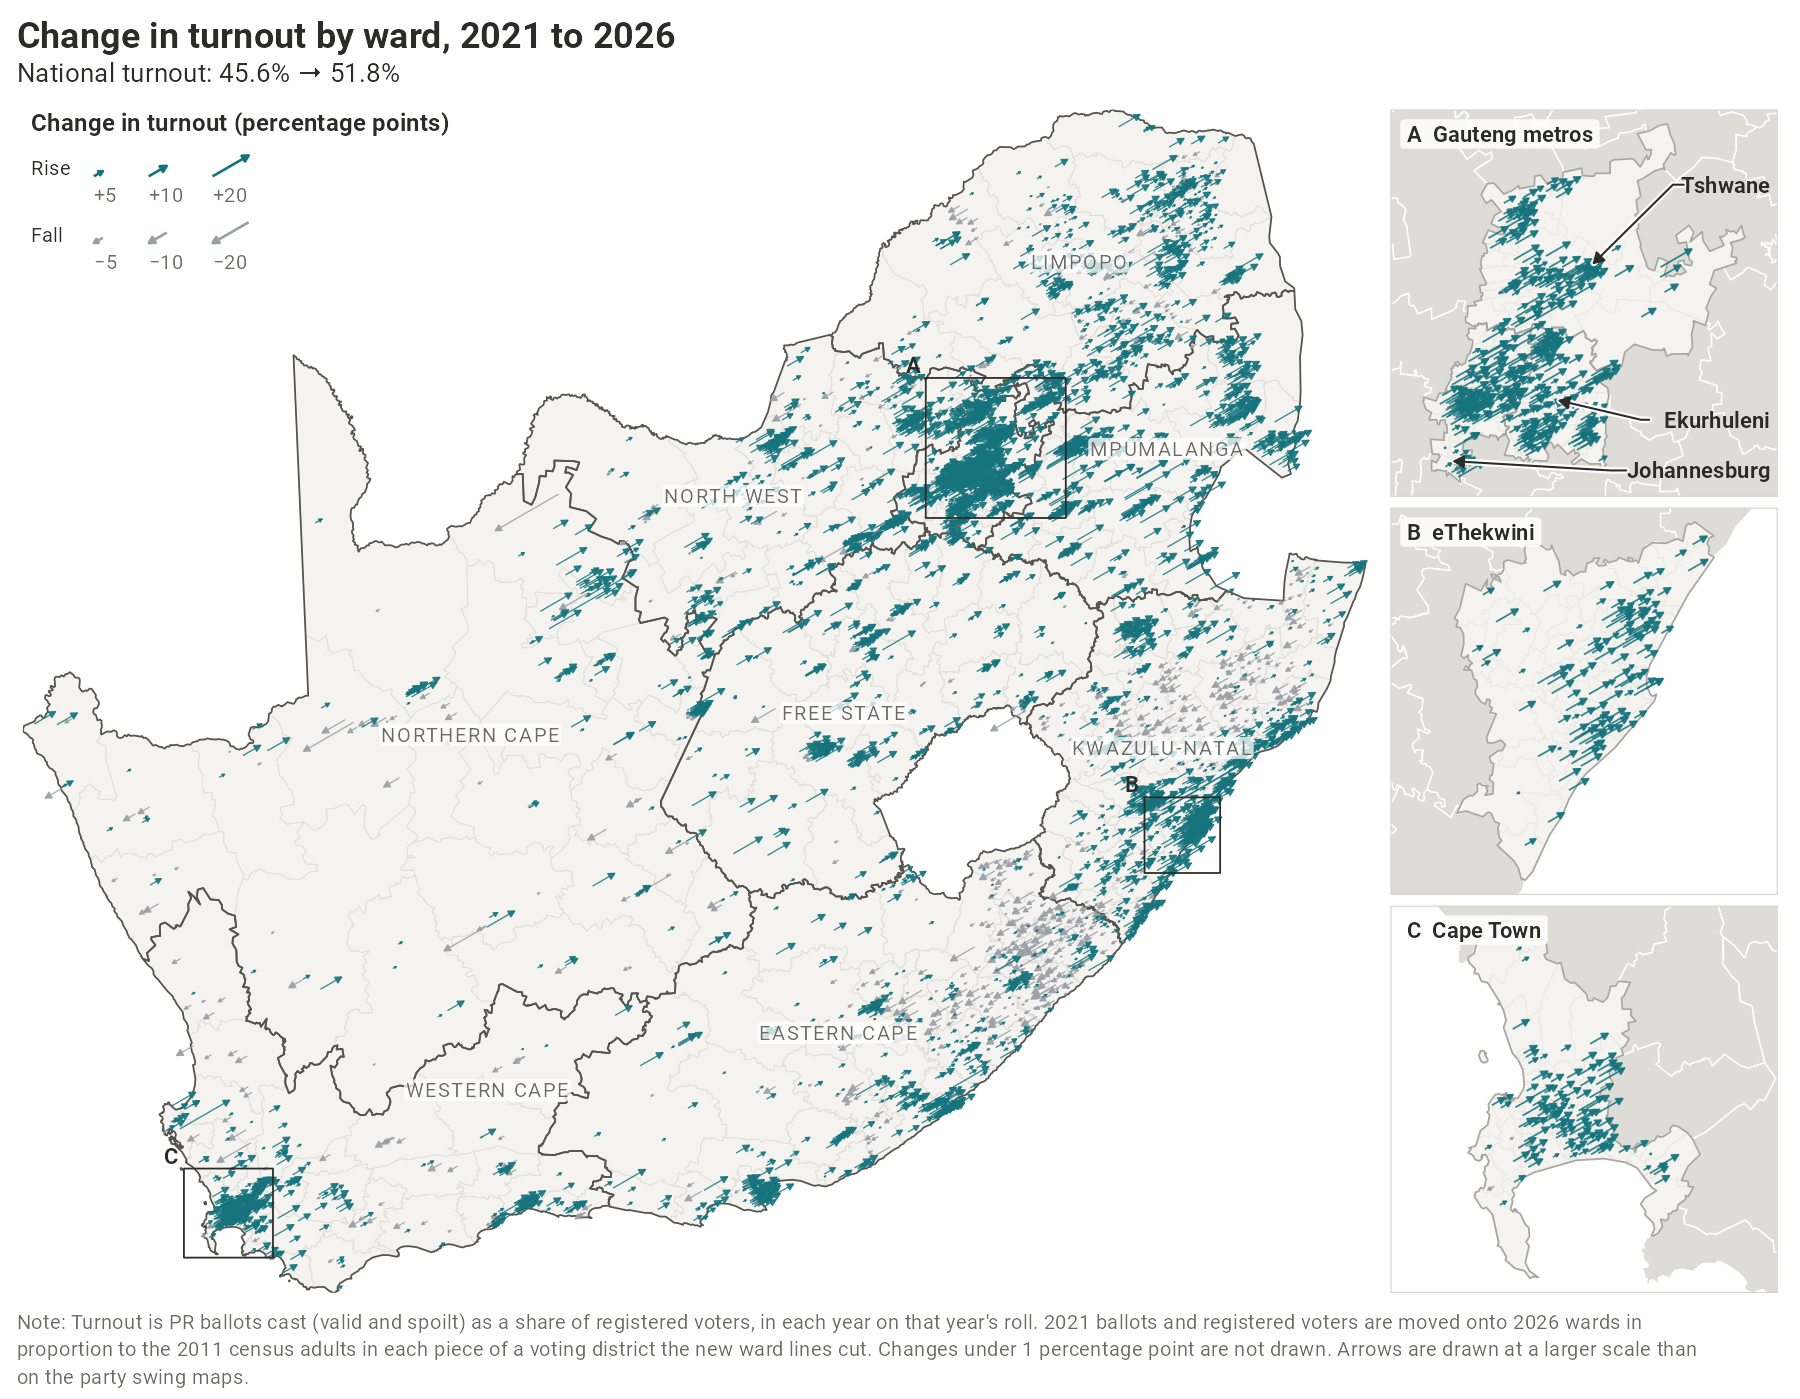
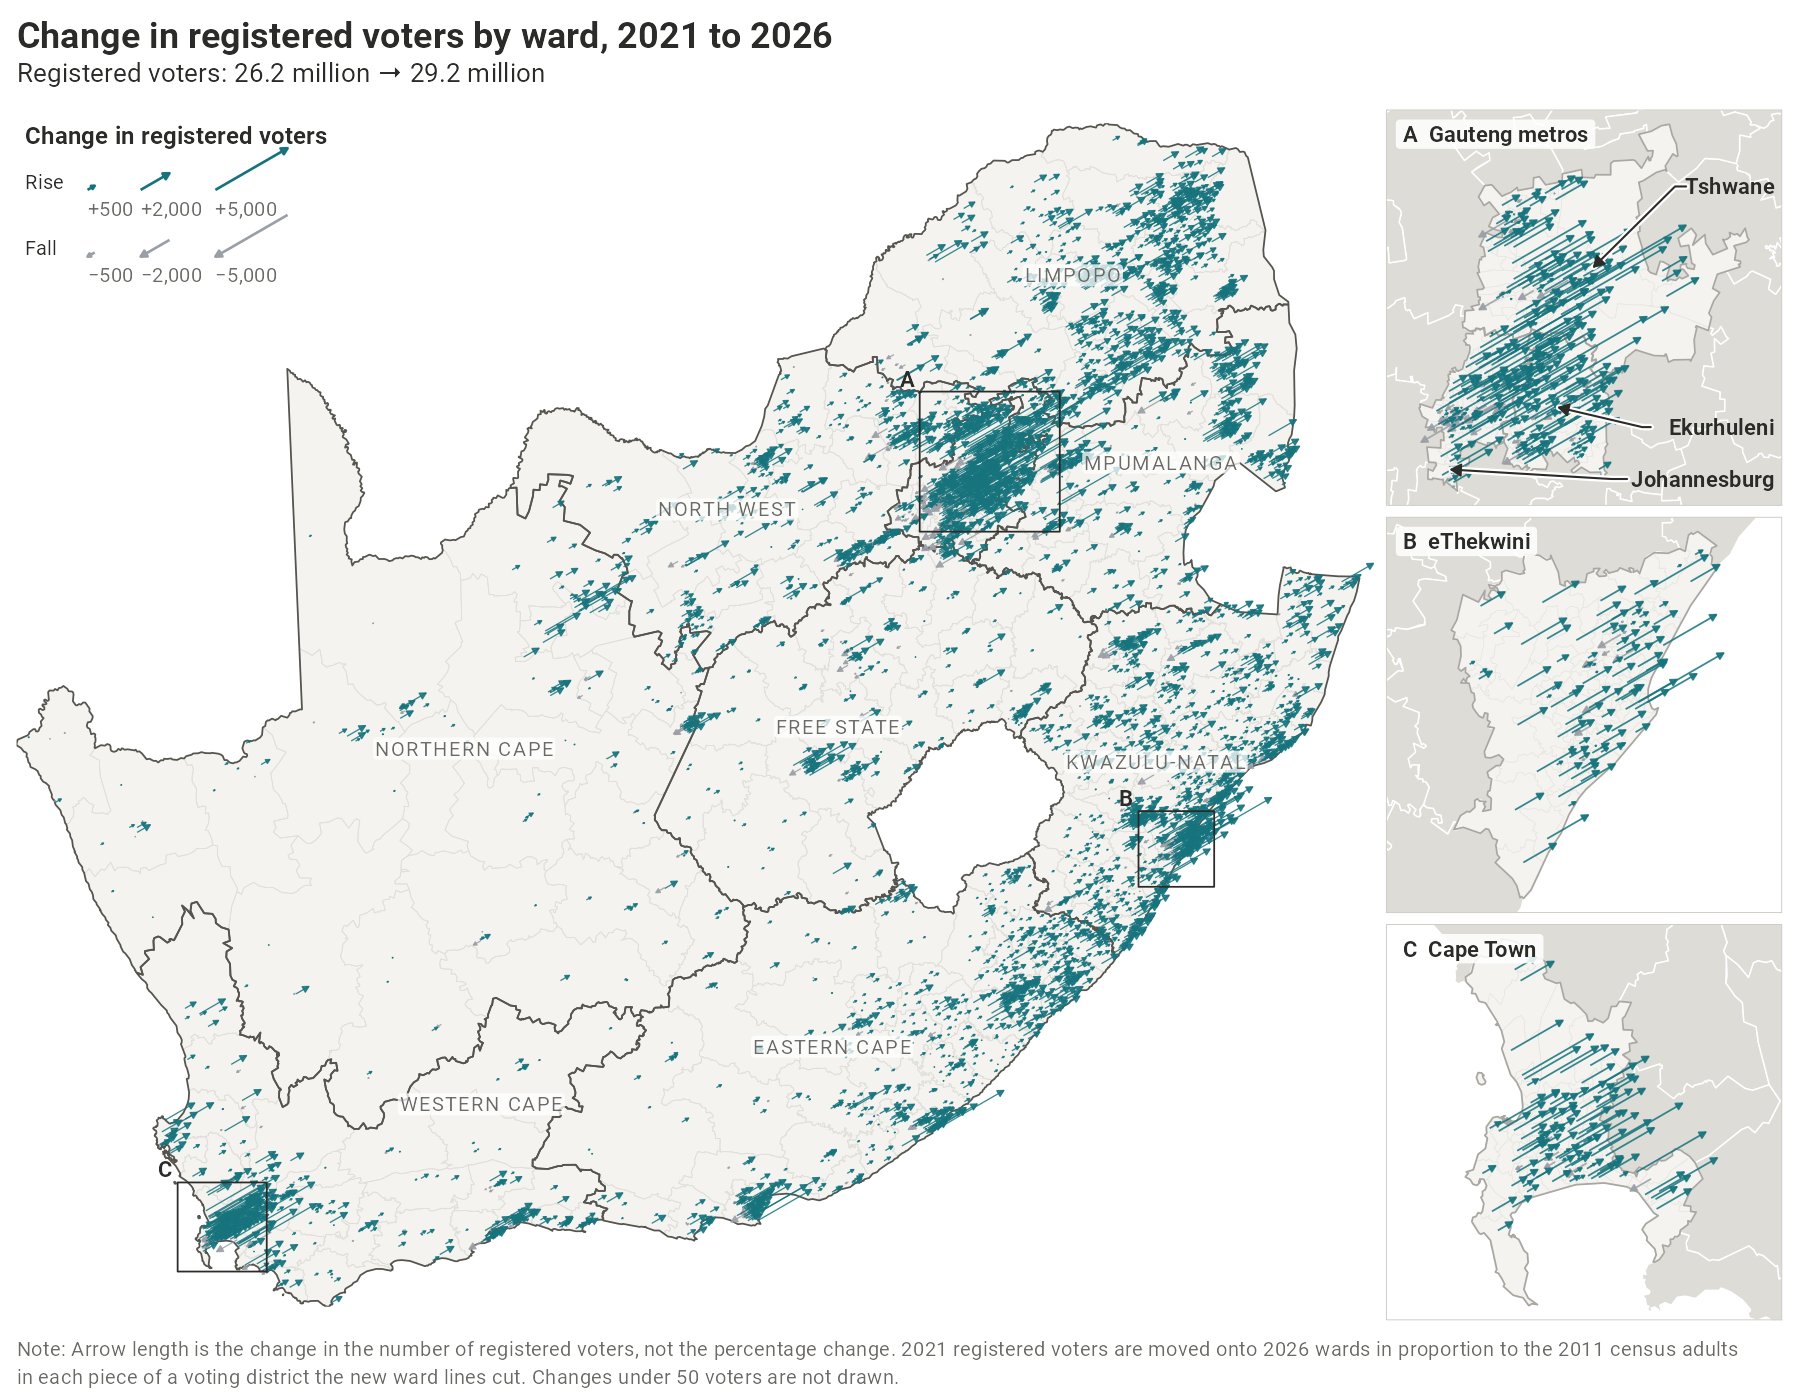
This interactive map allows you to explore the election results by ward. One warning: the map is a choropleth, which gives misleading visual representations of election results because urban wards are much smaller than rural wards. It is thus best used as an exploratory device to learn about how parties performed at the micro-level. The map is most accessible in full screen.
On this page you can study the association between census variables and election outcomes. These analyses are descriptive cross-sectional associations at the ward level. They can be used to answer descriptive questions such as “what types of areas voted for (or against) the ANC?”, “what types of areas swung toward (or away from) the DA?” or “what types of areas had high (or low) turnout?” They cannot tell us why these things happened, or how individual voters behaved. See data and methods for a more detailed discussion.
| Data | Source | Used for |
|---|---|---|
| Election results by voting district, 2021 and 2026 | Electoral Commission of South Africa | Every map |
| Municipal council seats and control | Electoral Commission of South Africa, results dashboard | Municipal council maps |
| Voting district boundaries, 2021 | Electoral Commission of South Africa | Moving 2021 results onto 2026 wards |
| Ward and municipal boundaries, 2026 | Municipal Demarcation Board | Every map |
| Census 2011, small-area statistics | Statistics South Africa | Moving 2021 results onto 2026 wards; where each ward’s square or arrow is drawn (the centre of where its adults live); the census and the vote tab |
| Census 2022, ward estimates (population group, age, sex) | Statistics South Africa | The census and the vote tab |
| Ward boundaries, 2020 | Municipal Demarcation Board | Moving the 2022 census estimates onto the 2026 wards |
Note: The 2026 results were downloaded from the Electoral Commission’s results files before they were certified. In four 2026 wards one voting district had no results in those files: Siyancuma ward 3 (Northern Cape), Matjhabeng ward 33 (Free State), Ray Nkonyeni ward 13 and Msunduzi ward 8 (both KwaZulu-Natal). These wards’ 2026 vote shares, swings, turnout and change in registration are not shown on the maps or in the census and the vote tab; the votes recorded in their other districts still count in every national, provincial and municipal total.
Some of the most interesting insights come from studying vote swings between elections. This requires what is called a “panel” dataset – data that shows us the same unit (e.g. ward or municipality) over time.
This is complicated by the fact that the Municipal Demarcation Board redraws ward boundaries between each LGE. Many of the 2026 ward codes were already in use in 2021 but now describe a different area, with only about 1,900 of the 4,485 wards essentially unchanged. The Electoral Commission also redraws its voting districts, the small areas served by a single voting station, and sometimes reassigns voting stations, before each election. Reconciling the 2021 returns, which are treated as described in the data sources tab, to the 2026 geography thus requires some decisions.
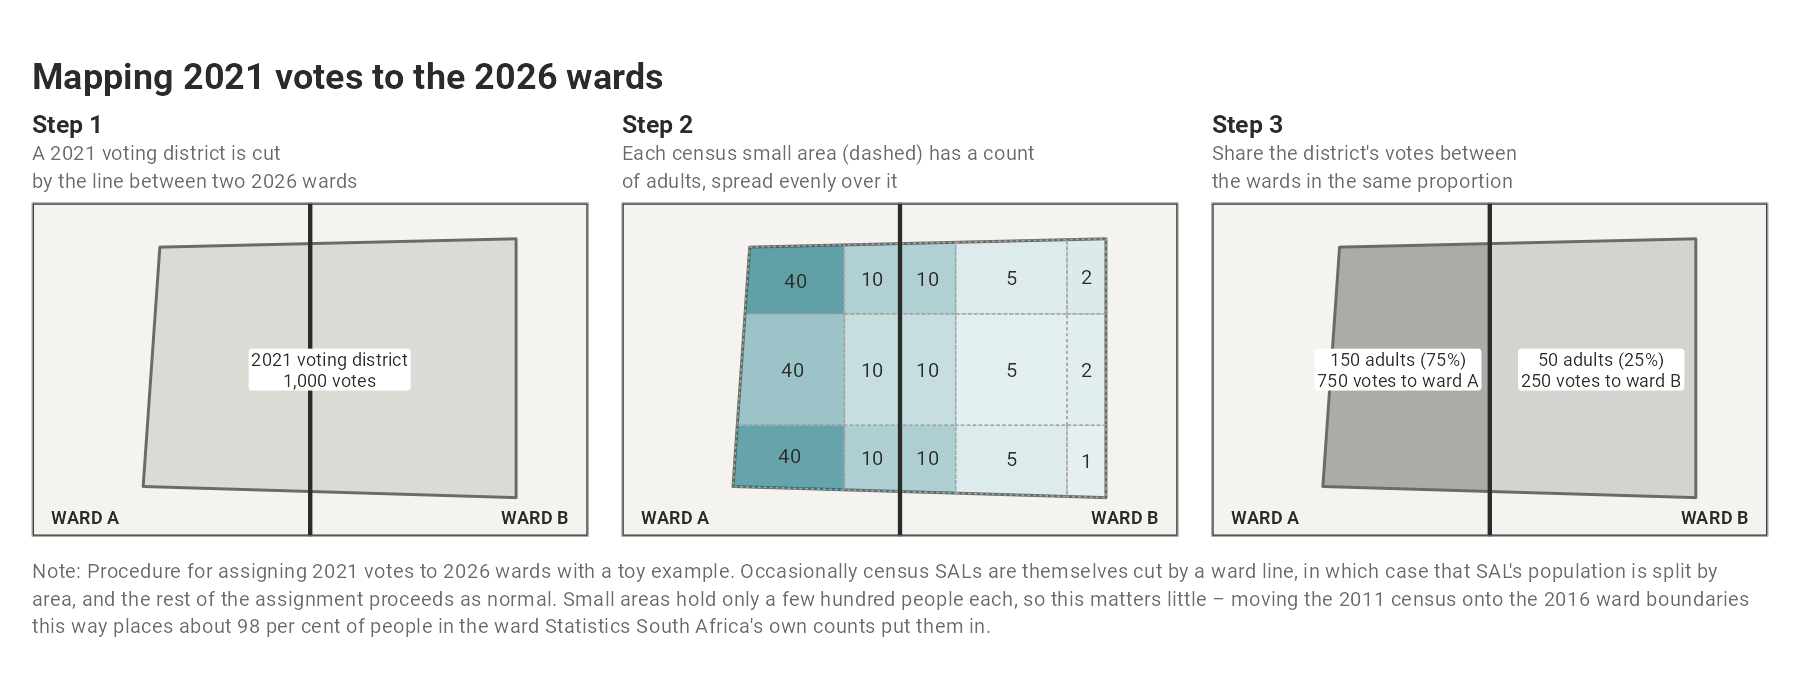
The 2026 results need no estimation: each 2026 voting district lies within a single ward, so ward totals are exact sums of district results. The 2021 results are moved onto the 2026 wards using the underlying voting district returns from 2021. Where a 2021 voting district lies entirely within one 2026 ward, its votes are allocated there in their entirety.
However, where a 2021 voting district is split among multiple 2026 wards, its votes are shared among each ward in proportion to the number of adults living in each, as counted in the 2011 census small-area layer. The 2011 census is the most recent released in full for small areas (Statistics South Africa will not release results from the 2022 Census at this level). All returns from 2021 move together (registered voters, ballots, and each party’s votes) and every 2021 vote is placed exactly once only, and so the panel’s totals for each year equal the official results from 2021. In tests on elections where the true answer is known, this method typically recovers a ward’s vote shares to within a few percentage points. Changes in individual wards that were heavily redrawn should still be read with care.
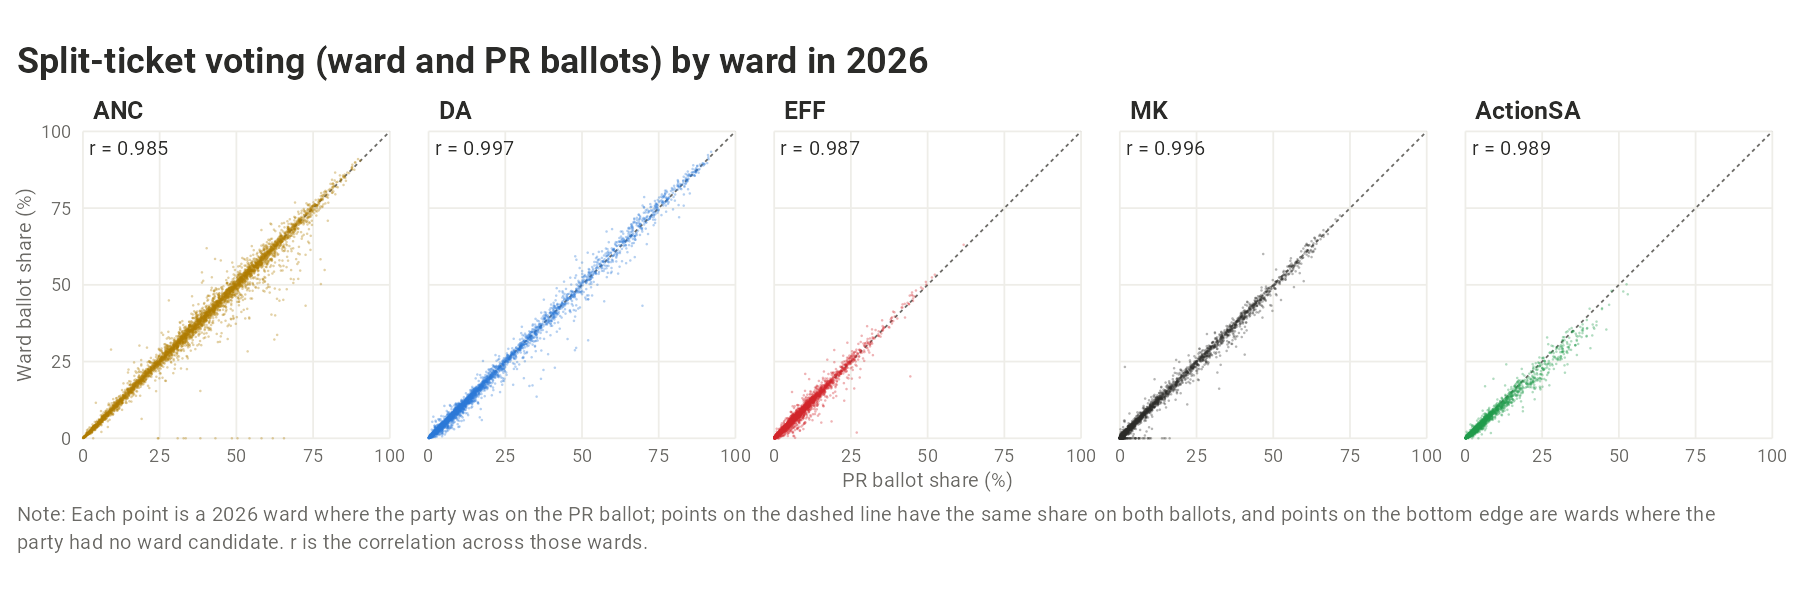
Apart from the municipal council maps, the maps use only the proportional representation (PR) ballot, the ballot on which every voter in a municipality chooses among the same parties. The ward ballot is left out because it is a vote for a candidate rather than a party, and so depends on who the candidate is. The two ballots nonetheless go together closely: across the 2026 wards, the correlation between a party’s share on the PR ballot and on the ward ballot is between 0.985 (ANC) and 0.997 (DA) for the five parties shown, and where a party had a ward candidate its two shares differ by about one percentage point on average. Municipal council seats are allocated on the ward and PR votes combined, and the Electoral Commission’s results dashboard reports a voting district’s ward and PR votes added together, so its district figures are roughly twice those used here.
Variables are defined as follows:
- Vote share: a party’s PR votes divided by all valid PR votes, in per cent.
- Turnout: PR ballots cast (valid and spoilt) in the ward divided by registered voters in the ward, for each election year (i.e., 2021 ballots divided by 2021 registration).
- Swing: the 2026 share minus the 2021 share, in percentage points. For parties that did not exist in 2021 (e.g. MK), this is simply their vote share in 2026 (2026 share minus 0%). Remember, swings are bounded by where a party started: a party with 0% in 2021 cannot swing down, and one close to 100% has little room to rise. Large gains therefore tend to come where a party started low and large losses where it started high, so a ward’s swing is best read alongside the party’s 2021 share there.
- Did not stand: hatched areas are municipalities in which a party was not listed on the 2026 PR ballot (a party on the ballot that won no votes in a ward is shown as 0%, not hatched).
A conventional election map shades each ward by its result. This means that large, thinly populated rural wards dominate the picture while dense urban wards, where most people vote, almost disappear. As is often said of American political maps, ‘land doesn’t vote, people vote.’ Most maps on this site are drawn so that voters, not land, take up the space.
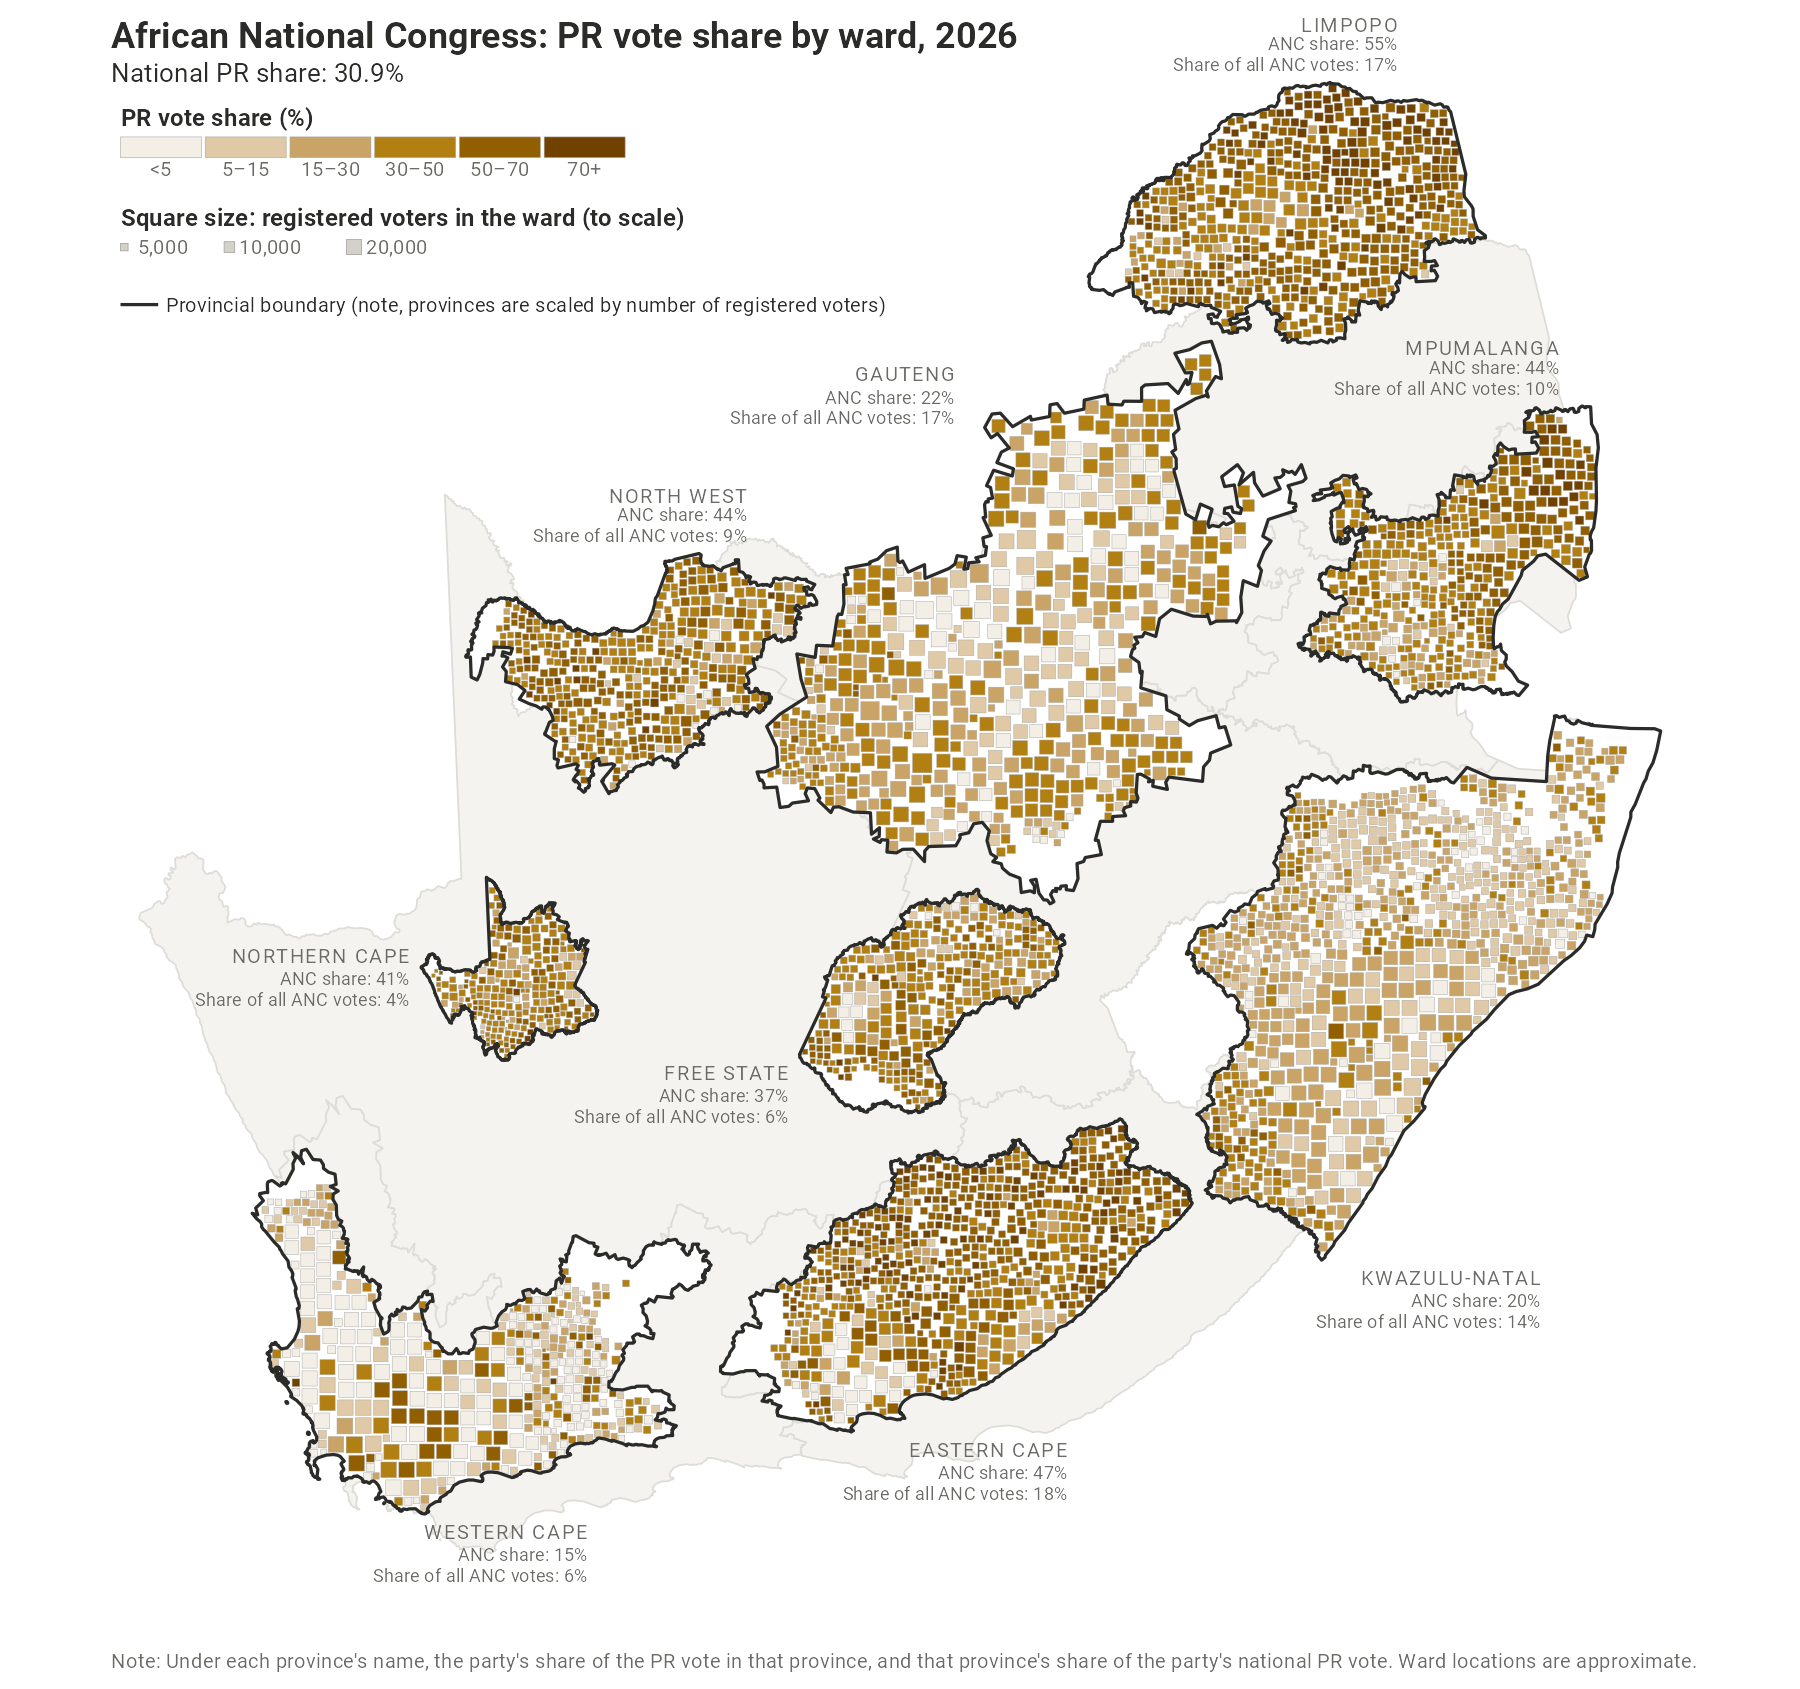
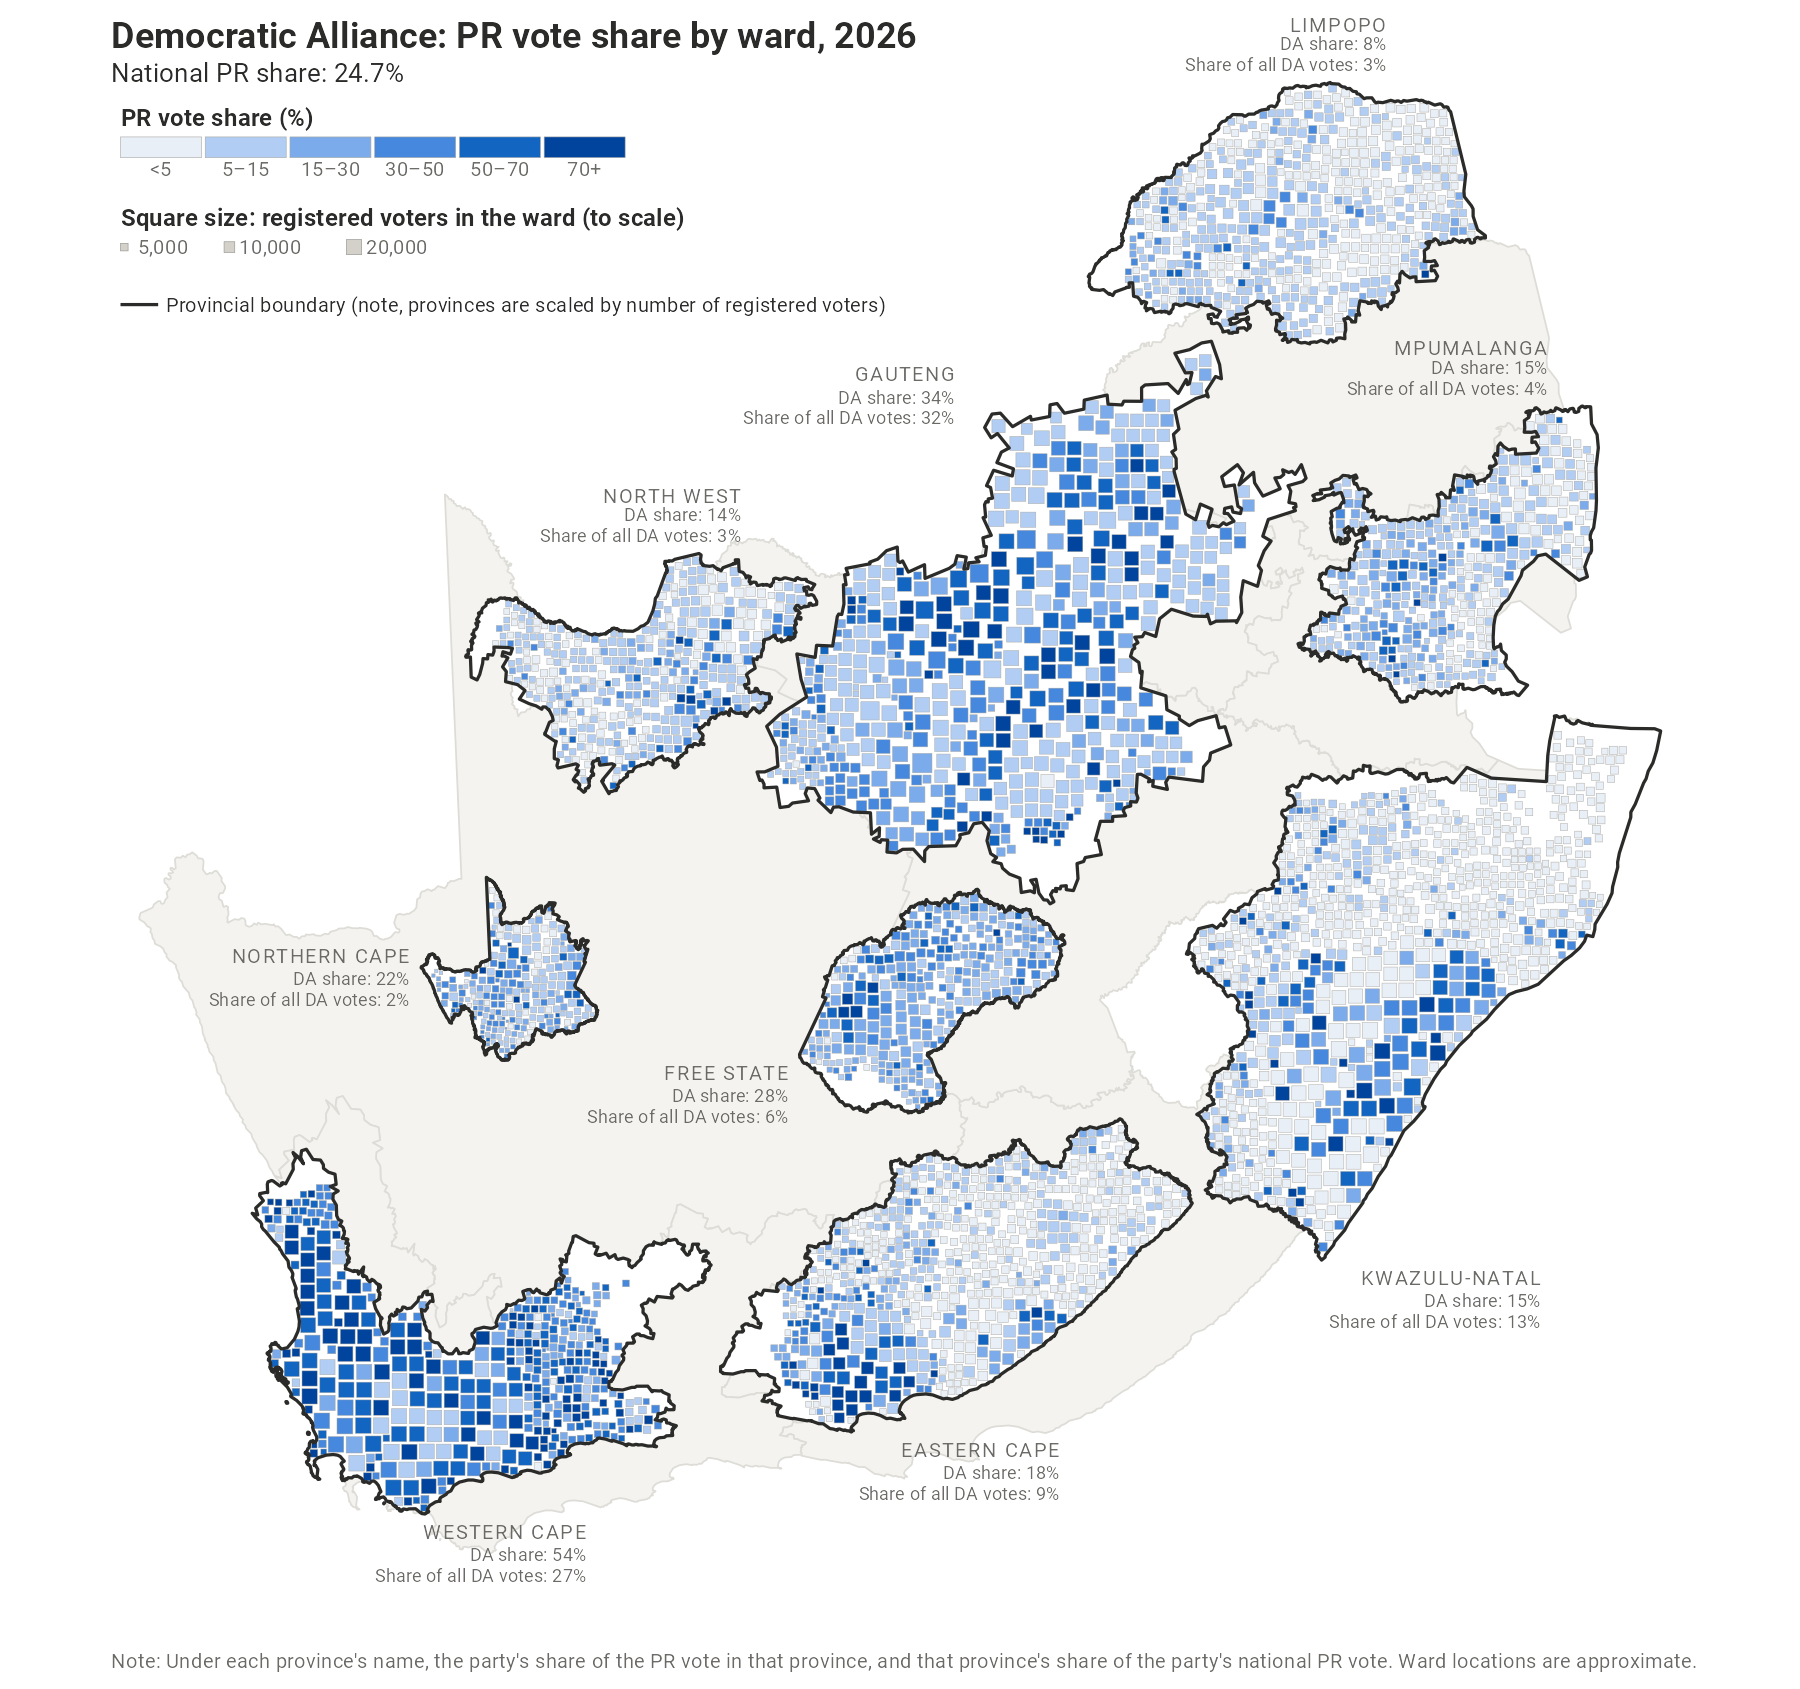
- Ward-square maps (the vote share, metro and 2026 turnout maps) draw each ward as a square, sized by its registered voters and placed as close as possible to where its residents live. On the national maps, each province is redrawn to the size of its electorate, so a province with twice the voters is twice the area. Because squares cannot overlap, in crowded areas some are pushed away from their ward, sometimes by a long way, so the position of any one square should be read as approximate.
- Swing maps (the party swings, and the changes in turnout and in registered voters) are drawn on conventional geography, with one arrow per ward starting at the population-weighted centroid of the ward. Arrows pointing up and to the right, in the colour of the party (teal for turnout and registration), show gains. Those pointing down and to the left in grey show losses. The length of each arrow shows the size of the change: in percentage points for vote shares and turnout, and in voters for registration. The metro insets use the same scale as the national map.
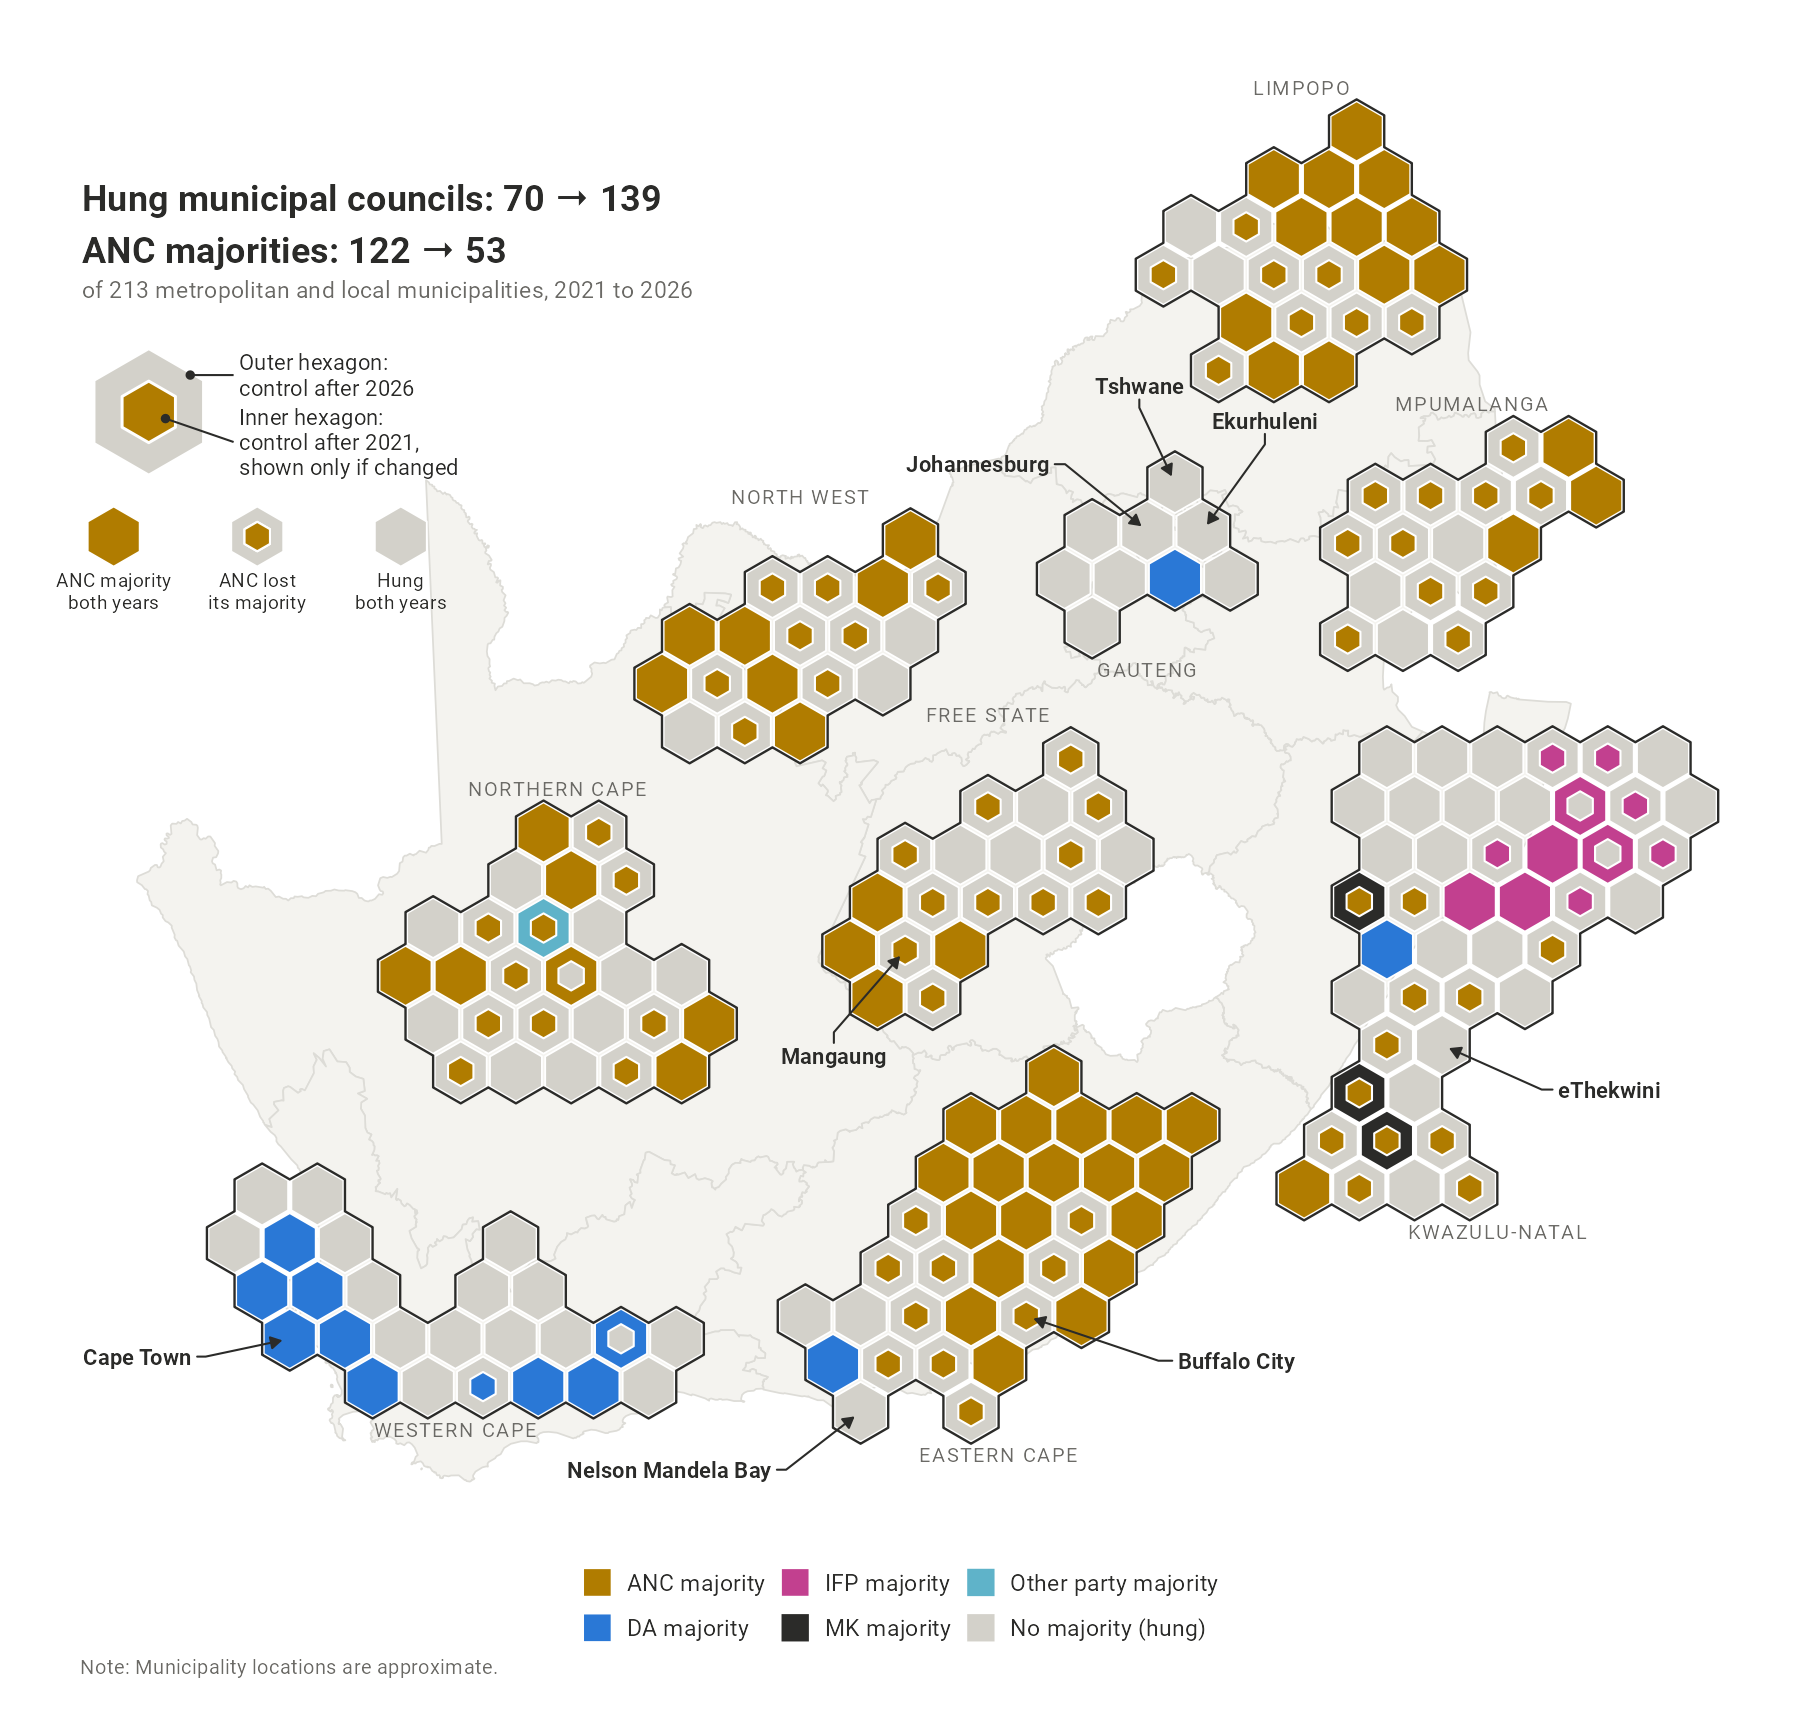
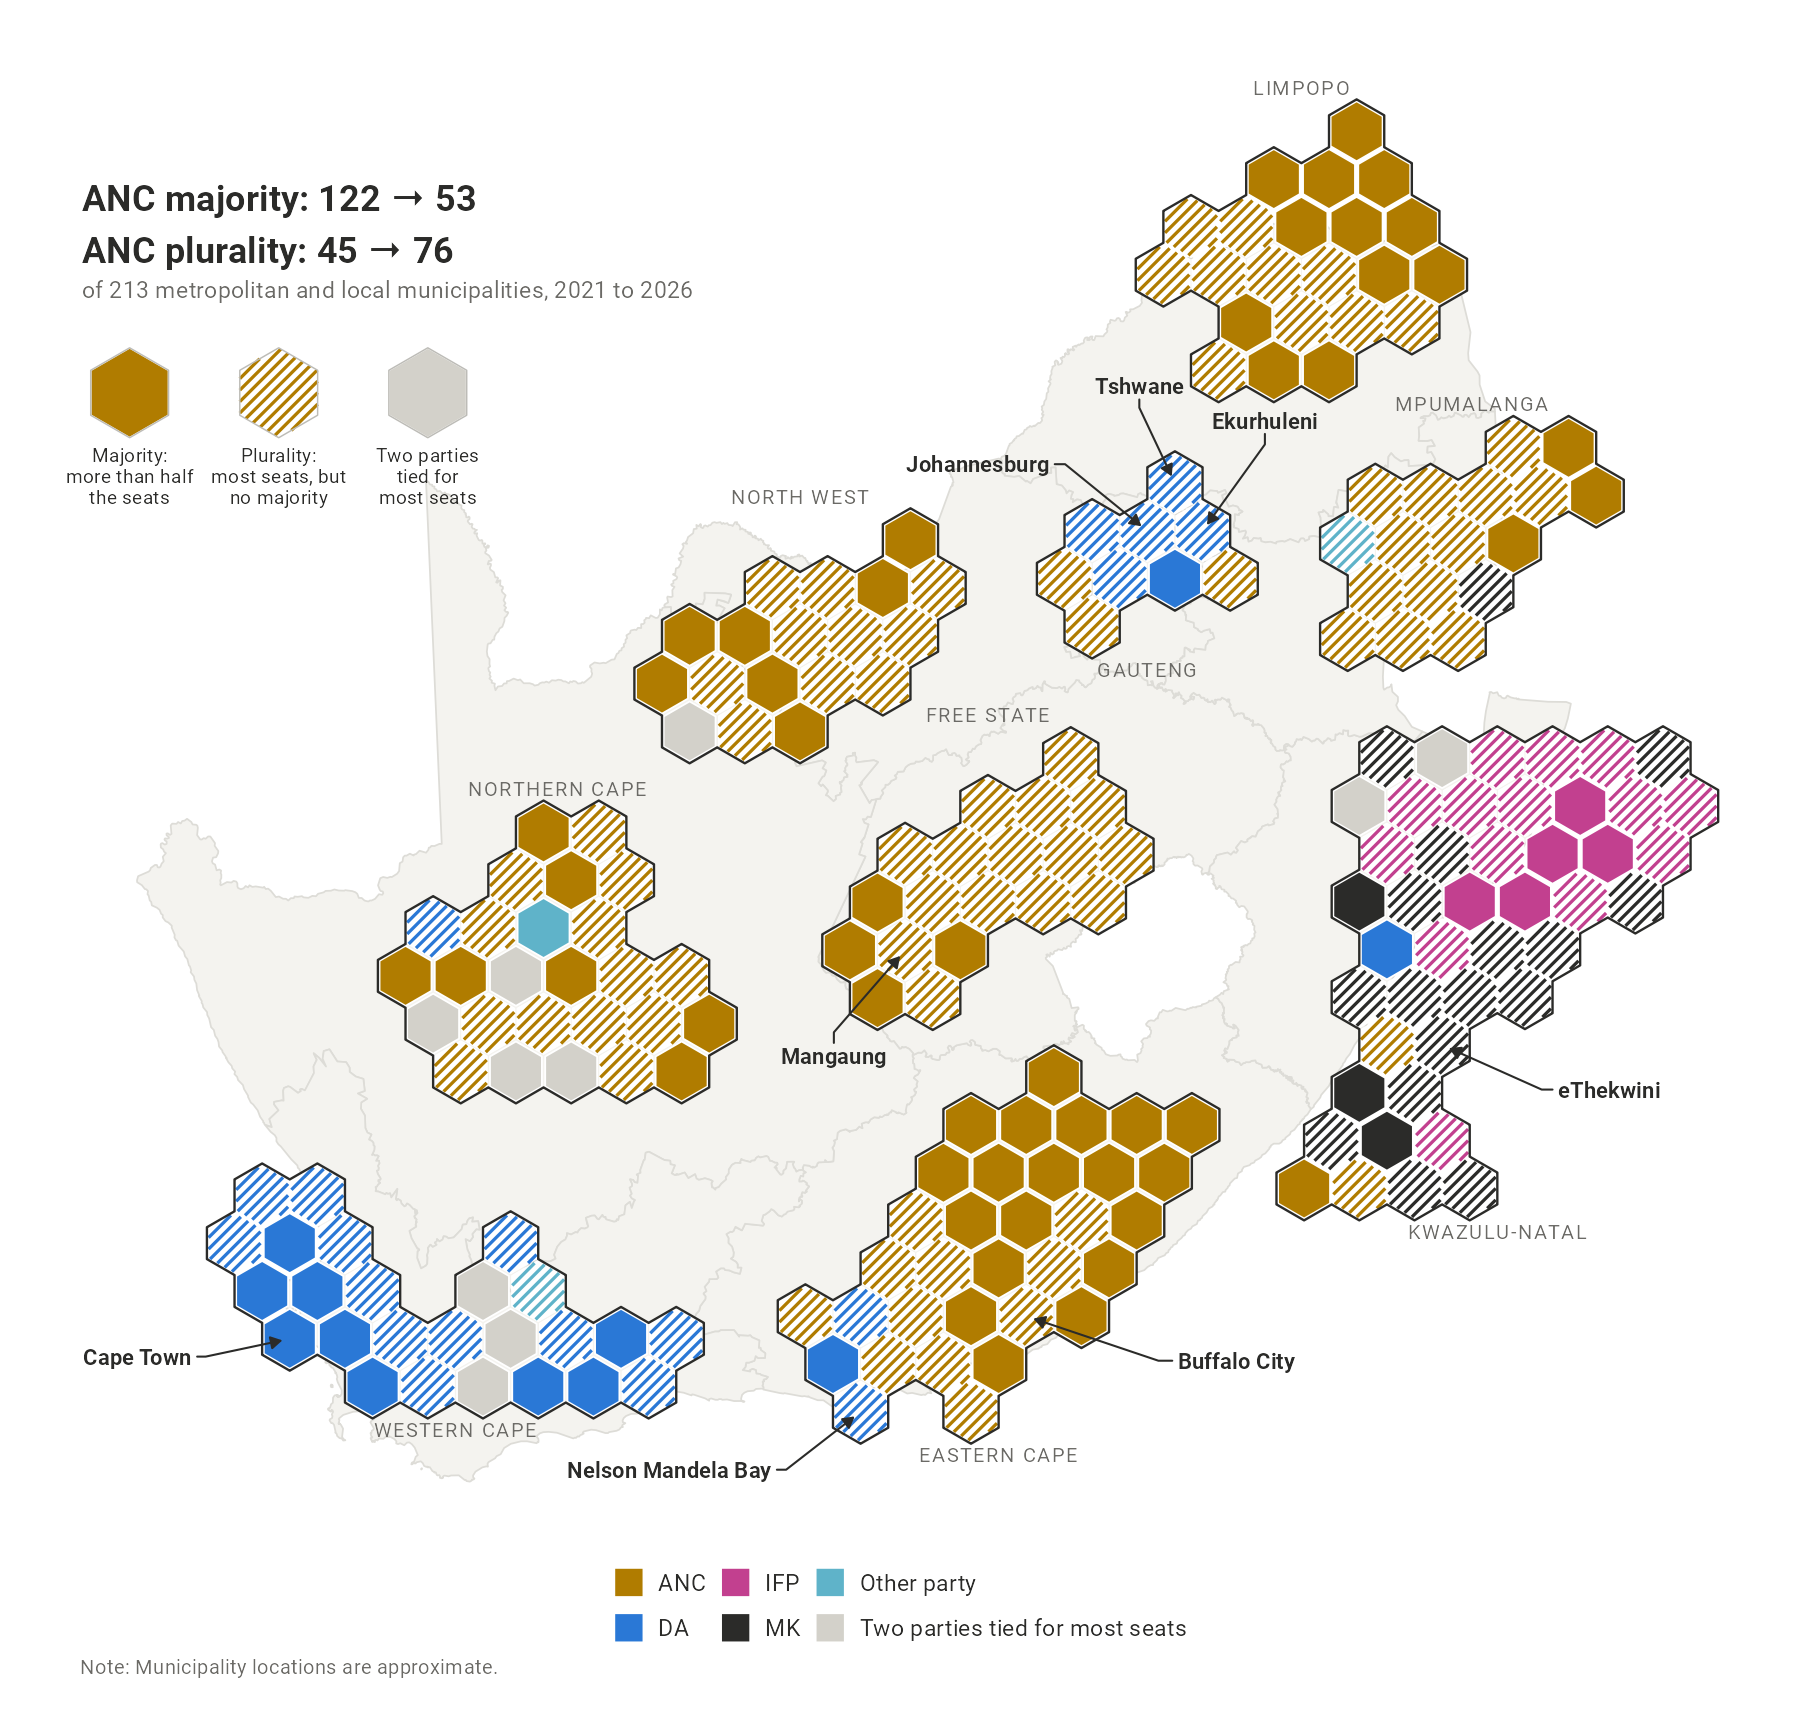
- Municipal council maps draw each municipality as one hexagon of the same size. Municipalities are grouped by province and kept close to their real positions. A province’s size on these maps therefore reflects how many municipalities it has, not its area or its number of voters: the Northern Cape, with 26 municipalities and 2% of registered voters, appears almost three times the size of Gauteng, with 9 municipalities and 23% of voters.
- The interactive map is a conventional choropleth map, coloured ward by ward. It is best used to explore places rather than to judge overall patterns.
The census and the vote tab compares the election results with the characteristics of each ward’s residents, drawn from either the 2011 or the 2022 census. Neither census was enumerated on the 2026 wards, so both must first be fit to that geography.
The 2011 census was released in full for small areas of a few hundred people each. Each small area is assigned to the 2026 ward that contains its centre, and its counts are summed by ward. Home language comes from a separate small-area table of the same census.
Statistics South Africa has not released small area data for the 2022 census. The data have only been made available as modelled estimates of population group, age and sex, on the 2020 wards. Where a 2020 ward lies within a single 2026 ward, its 2022 counts carry over unchanged. Where a 2020 ward is split among several 2026 wards, we share each of its 2022 counts (say, its coloured residents, or its residents aged 20 to 24) among those wards according to where people in that same group lived within the 2020 ward in 2011. For example, if 80% of a 2020 ward’s coloured residents in 2011 lived in the part that now falls in one 2026 ward, that ward receives 80% of the 2020 ward’s coloured residents in 2022, even though it may receive a quite different share of its Black African or white residents. A 2020 ward divided between a suburb and a township thus sends each group mainly to the side where it lived in 2011, rather than splitting every group in the same proportion. Where a 2011 small area is itself cut by a boundary, its residents are taken to be spread evenly across its area, and where a group had no residents in a 2020 ward in 2011, the ward’s total 2011 population is used instead. The method assumes that where each group lives within a ward has changed little since 2011. All 62.0 million people in the 2022 estimates are placed on the 2026 wards exactly once.
Variables are defined as follows:
- Census variables: each is a percentage of the relevant base. Population group, age, sex, settlement type, birthplace and home language are shares of all residents; schooling is a share of adults; unemployment is a share of the labour force, on the expanded definition, which counts discouraged work-seekers as unemployed; employment is a share of people of working age; and income is a share of households.
- Population density: the base-10 logarithm of people per square kilometre.
Each plot fits a straight line across the wards shown (all wards, those in one province, or those in one of the eight metros) by ordinary least squares, with each ward counted once. The slope is the expected difference in the outcome between two wards one unit apart on the census variable (one percentage point, or ten times the density). Wards in the same municipality tend to resemble one another on both the outcome and the explanatory variable, so inference is based on standard errors clustered by municipality. Where a selection covers fewer than 10 municipalities (every Gauteng view, and some party outcomes within a province, such as MK in the Free State, where it stood in one municipality), there are too few municipalities to cluster on, so the tool reports heteroskedasticity-robust (HC1) standard errors instead and shows a warning. Within a single metro all the wards are in one municipality, so there is nothing to cluster on, and heteroskedasticity-robust standard errors are the appropriate ones. The optional loess curve is a smoothed local average that shows the shape of the relationship.
The results from these regressions should be interpreted for what they are: unconditional linear associations across wards. The estimated slope may capture anything else correlated with the census variable. Any observed pattern across wards is also subject to the ecological inference problem – the relationship need not hold for individual voters. The 2011 census is 15 years older than the election, and the 2022 ward estimates are modelled rather than counted, so both should be read as broad descriptions of places. Where most wards are zero on a variable (e.g., living on farms), the slope rests on the few that are not.
Municipal council control and seats come from the Electoral Commission’s results dashboard, downloaded on 9 November 2026. Two councils, Mnquma (EC122) and King Sabata Dalindyebo (EC157), had not yet been fully allocated then, so their seats come from the dashboard on 22 November; both are hung, with the ANC as the largest party. As a check, we also allocate every council’s seats from the returns with the statutory formula: for those two councils it gives exactly the seats the dashboard lists for each party.